
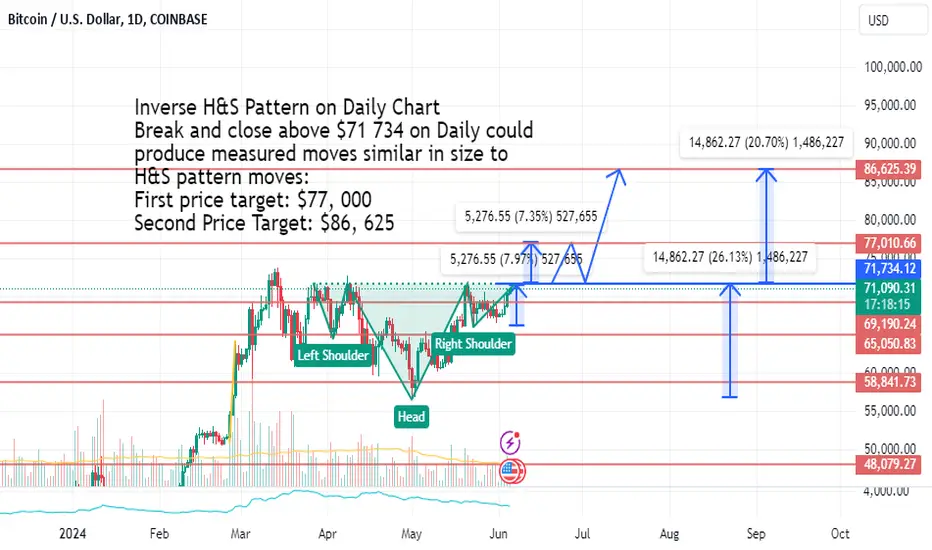
Inverse H&S Pattern is almost completely formed on the Daily Chart.
A Break and close above $71 734 on Daily chart could result in measured moves corresponding with the moves in the Inverse head and shoulder pattern. My prediction: if a Daily close above this level, then we'd see a break upwards to $FWB:77K, retrace back to neckline, and bounce up to $86, 625.
First price target: $77, 000
Second Price Target: $86, 625
Amateur pattern and technical analysis trader. NOT investment advice. Making these posts to document my own journey and thought processes/development on here.
A Break and close above $71 734 on Daily chart could result in measured moves corresponding with the moves in the Inverse head and shoulder pattern. My prediction: if a Daily close above this level, then we'd see a break upwards to $FWB:77K, retrace back to neckline, and bounce up to $86, 625.
First price target: $77, 000
Second Price Target: $86, 625
Amateur pattern and technical analysis trader. NOT investment advice. Making these posts to document my own journey and thought processes/development on here.

免責事項
これらの情報および投稿は、TradingViewが提供または承認する金融、投資、取引、またはその他の種類の助言もしくは推奨であることを意図したものではなく、またこれらに該当するものでもありません。詳細は利用規約をご覧ください。
免責事項
これらの情報および投稿は、TradingViewが提供または承認する金融、投資、取引、またはその他の種類の助言もしくは推奨であることを意図したものではなく、またこれらに該当するものでもありません。詳細は利用規約をご覧ください。