
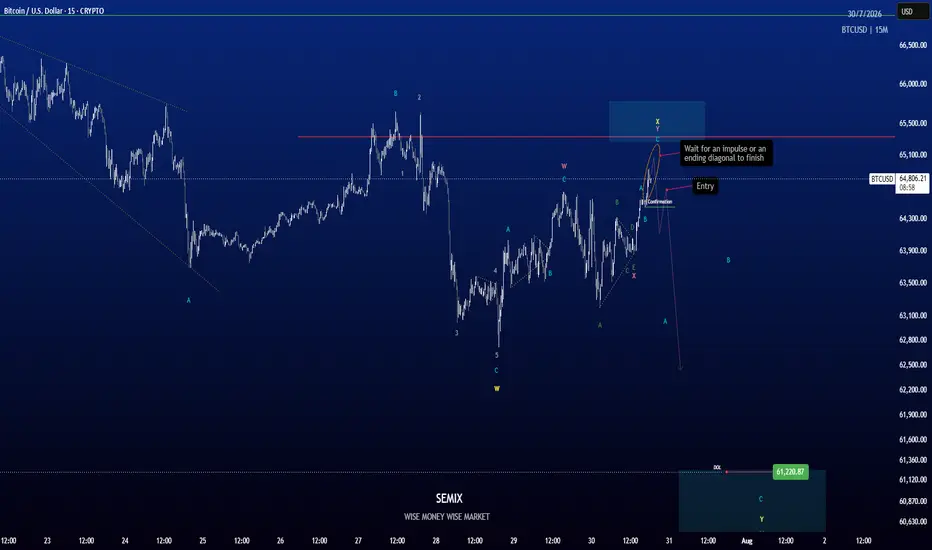
after we finishing this impulse or an ending diagonal in blue colour wave c. we can see a bearish sentiment continuation toward 61220 area before a short term bounce back towards 72K region.
I have published earlier my alternative scenario that bitcoin will be in a side way range till mid September and this idea is a lower time frame idea of that.
for this idea a break below 64454.17 (crypto chart) is the confirmation and after a pullback we can enter for a short trade and invalid level will be the high of ( end of ) blue colour c wave.
I have published earlier my alternative scenario that bitcoin will be in a side way range till mid September and this idea is a lower time frame idea of that.
for this idea a break below 64454.17 (crypto chart) is the confirmation and after a pullback we can enter for a short trade and invalid level will be the high of ( end of ) blue colour c wave.
トレード稼働中
Market rejected from the red the redline on my chart and heading through to the target
免責事項
これらの情報および投稿は、TradingViewが提供または承認する金融、投資、取引、またはその他の種類の助言もしくは推奨であることを意図したものではなく、またこれらに該当するものでもありません。詳細は利用規約をご覧ください。
免責事項
これらの情報および投稿は、TradingViewが提供または承認する金融、投資、取引、またはその他の種類の助言もしくは推奨であることを意図したものではなく、またこれらに該当するものでもありません。詳細は利用規約をご覧ください。