
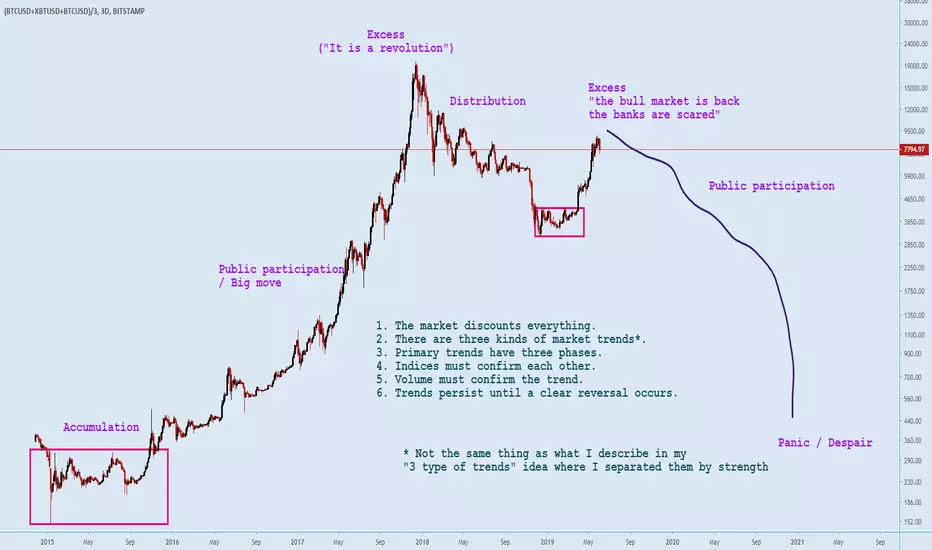
Charles H. Dow (with Edward Jones and Charles Bergstresser) founded the Dow Jones & Company Inc. and developped the Dow Jones Industrial Average (the big new thing back then were big industries, now it is big tech giants Apple Amazon Google Facebook... Next is going to be renewables and biotech nah just kidding next is a huge recession and WW3 and the end of modern civilisation too late to save the world).
Dow created a theory that he descrobed in editorials in the Wall Street Journal (which he dounded):
1. The market prices everything. Whether the participants know it or not. Even future events are priced in in the form of risk.
2. There are 3 kinds of market trends. Primary trends 1 year or more (bull or bear markets of different magnitude, consolidation). Secondary trends are pullbacks in a bull market and rallies (sharp ones) in a bear market. Last kind of trend < 3 weeks is basically noise. (Personal remark: for currencies & commodities this is different imo. For the stock market this is valid and has been for centuries)
3. Primary trends have three phases. Accumulation, public participation, excess phase in a bull market. In a bear market distribution, public participation, and panic (or despair) are the 3 phases. Check Elliot Wave theory too.
4. Indices must confirm each other. Dow used the DJIA and DJTA (transportation) indices. Now look at well the 3 USA ones and the other continents too...
5. Volume must confirm the trend. Low volume indicates a weakness in the trend. It should go up as price is going up.
6. The trend stays the primary trend until there is a CLEAR reversal.
(Tell that to FOMO moonboys)
Let's look at exemples of market cycles.
2012-2015:

2017-2021 on the linear chart:

All time, several ways to see it:


2018-2019:

Best to just look at examples:


Looking at volume... It's really not clear. The rule needs to be removed or changed.
With Bitcoin in the excess phase we clearly saw an explosion, and then decline. And that was the top.


Each market works differently but these cycles are seen everywhere.
I wanted to look at the new one, Bitcoin. Let's look at a few other ones.
Sugar ==>


Dow Jones ==>


Gold ==>

Copper ==>


EuroDollar ==>

Tesla ==>

Movie pass (LOL) ==>

Rektcoin ==>

Dow created a theory that he descrobed in editorials in the Wall Street Journal (which he dounded):
1. The market prices everything. Whether the participants know it or not. Even future events are priced in in the form of risk.
2. There are 3 kinds of market trends. Primary trends 1 year or more (bull or bear markets of different magnitude, consolidation). Secondary trends are pullbacks in a bull market and rallies (sharp ones) in a bear market. Last kind of trend < 3 weeks is basically noise. (Personal remark: for currencies & commodities this is different imo. For the stock market this is valid and has been for centuries)
3. Primary trends have three phases. Accumulation, public participation, excess phase in a bull market. In a bear market distribution, public participation, and panic (or despair) are the 3 phases. Check Elliot Wave theory too.
4. Indices must confirm each other. Dow used the DJIA and DJTA (transportation) indices. Now look at well the 3 USA ones and the other continents too...
5. Volume must confirm the trend. Low volume indicates a weakness in the trend. It should go up as price is going up.
6. The trend stays the primary trend until there is a CLEAR reversal.
(Tell that to FOMO moonboys)
Let's look at exemples of market cycles.
2012-2015:
2017-2021 on the linear chart:
All time, several ways to see it:
2018-2019:
Best to just look at examples:
Looking at volume... It's really not clear. The rule needs to be removed or changed.
With Bitcoin in the excess phase we clearly saw an explosion, and then decline. And that was the top.
Each market works differently but these cycles are seen everywhere.
I wanted to look at the new one, Bitcoin. Let's look at a few other ones.
Sugar ==>
Dow Jones ==>
Gold ==>
Copper ==>
EuroDollar ==>
Tesla ==>
Movie pass (LOL) ==>
Rektcoin ==>

Join me on Telegram: 💲💲💲 t.me/MrRenevGambling
TradingView referral link:
tradingview.com/gopro/?share_your_love=MrRenev
TradingView referral link:
tradingview.com/gopro/?share_your_love=MrRenev
免責事項
これらの情報および投稿は、TradingViewが提供または承認する金融、投資、取引、またはその他の種類の助言もしくは推奨であることを意図したものではなく、またこれらに該当するものでもありません。詳細は利用規約をご覧ください。
Join me on Telegram: 💲💲💲 t.me/MrRenevGambling
TradingView referral link:
tradingview.com/gopro/?share_your_love=MrRenev
TradingView referral link:
tradingview.com/gopro/?share_your_love=MrRenev
免責事項
これらの情報および投稿は、TradingViewが提供または承認する金融、投資、取引、またはその他の種類の助言もしくは推奨であることを意図したものではなく、またこれらに該当するものでもありません。詳細は利用規約をご覧ください。