
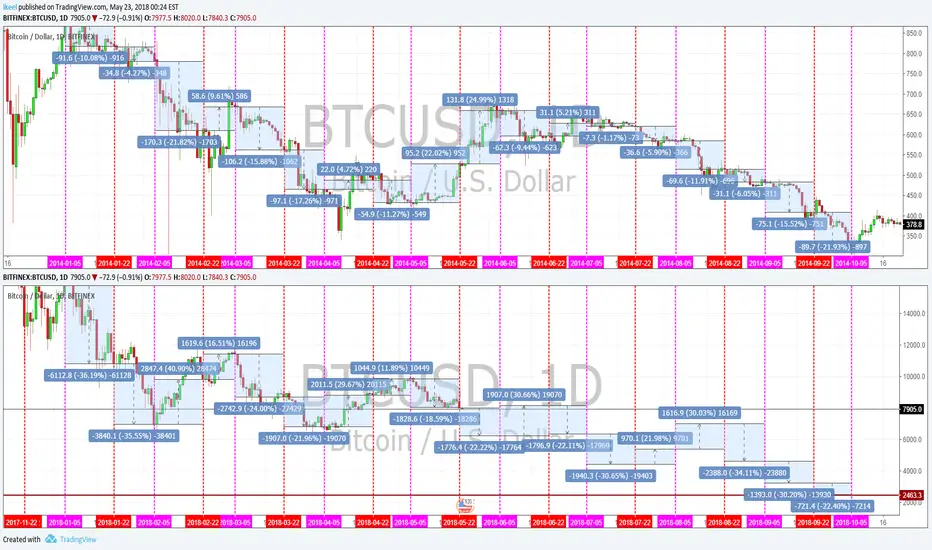
Here I compare price behavior in two types of intervals whilst comparing the 2014 & 2018 bear marketing starting from the new year.
Jan-Oct 2014 bear market:
Jan-Oct 2018 bear market:
Jan-Oct 2014 bear market:
- Red periods averaged 11.4% moves whilst Purple periods averaged 12.2% moves (from period candle close to close).
- Red periods saw twice as well downward moves, meanwhile Purple periods were 3.5x likely to be downward moves.
Jan-Oct 2018 bear market:
- Red periods averaged 22% moves whilst Purple periods averaged 30% moves (from period candle close to close).

免責事項
これらの情報および投稿は、TradingViewが提供または承認する金融、投資、取引、またはその他の種類の助言もしくは推奨であることを意図したものではなく、またこれらに該当するものでもありません。詳細は利用規約をご覧ください。
免責事項
これらの情報および投稿は、TradingViewが提供または承認する金融、投資、取引、またはその他の種類の助言もしくは推奨であることを意図したものではなく、またこれらに該当するものでもありません。詳細は利用規約をご覧ください。