
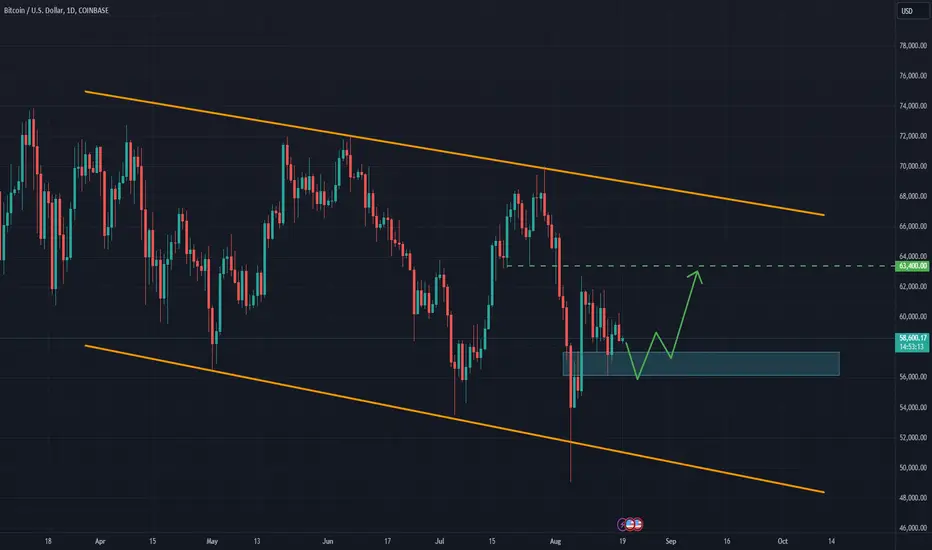
BTCUSD has seen a solid rebound off a crucial support level, successfully capturing liquidity at the previous month's low. Over the past week, the daily chart displayed choppy price action, leading to a period of consolidation within a tight range. Notably, the weekly timeframe has formed an inside bar pattern, signalling potential indecision among traders. A break and close above 63,000 could provide a strong bullish signal, potentially driving the market toward the next resistance level at 73,000. The upward momentum could persist, especially if the market rejects the prior week's low. On the 1H timeframe, a classic triangle pattern is unfolding, suggesting the price may continue oscillating within this structure before making a decisive move. The target is the resistance zone at 63,400

Website - rtedinvesting.com/
Free Telegram Channel - t.me/rtedinvestingofficialfreechannel
Free Telegram Channel - t.me/rtedinvestingofficialfreechannel
免責事項
これらの情報および投稿は、TradingViewが提供または承認する金融、投資、取引、またはその他の種類の助言もしくは推奨であることを意図したものではなく、またこれらに該当するものでもありません。詳細は利用規約をご覧ください。
Website - rtedinvesting.com/
Free Telegram Channel - t.me/rtedinvestingofficialfreechannel
Free Telegram Channel - t.me/rtedinvestingofficialfreechannel
免責事項
これらの情報および投稿は、TradingViewが提供または承認する金融、投資、取引、またはその他の種類の助言もしくは推奨であることを意図したものではなく、またこれらに該当するものでもありません。詳細は利用規約をご覧ください。