
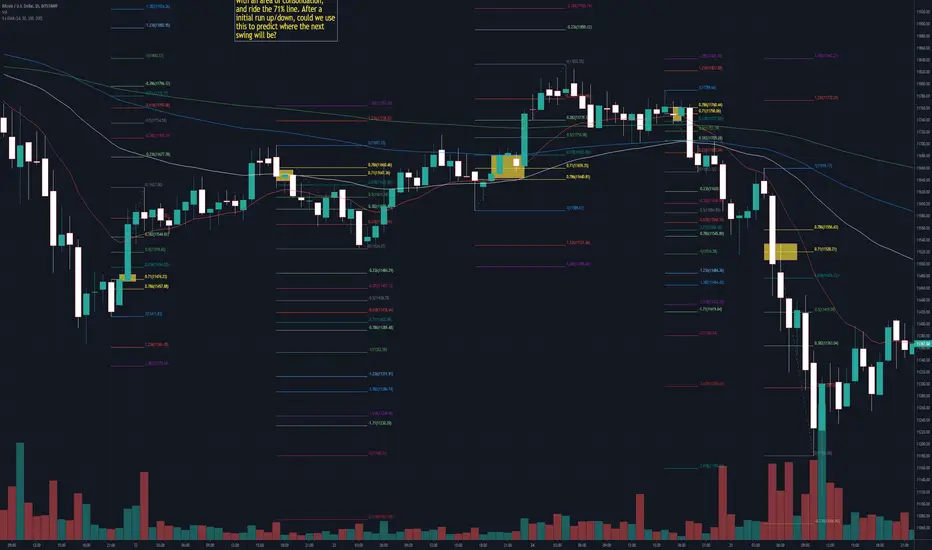
I have started to notice that, when I draw my Fib's, between the initial run from 1.0 to 0.0, the 0.71 often ends up aligning with an area of consolidation, and ride the 71% line. After a initial run up/down, could we use this to predict where the next swing will be?

免責事項
これらの情報および投稿は、TradingViewが提供または承認する金融、投資、取引、またはその他の種類の助言もしくは推奨であることを意図したものではなく、またこれらに該当するものでもありません。詳細は利用規約をご覧ください。
免責事項
これらの情報および投稿は、TradingViewが提供または承認する金融、投資、取引、またはその他の種類の助言もしくは推奨であることを意図したものではなく、またこれらに該当するものでもありません。詳細は利用規約をご覧ください。