
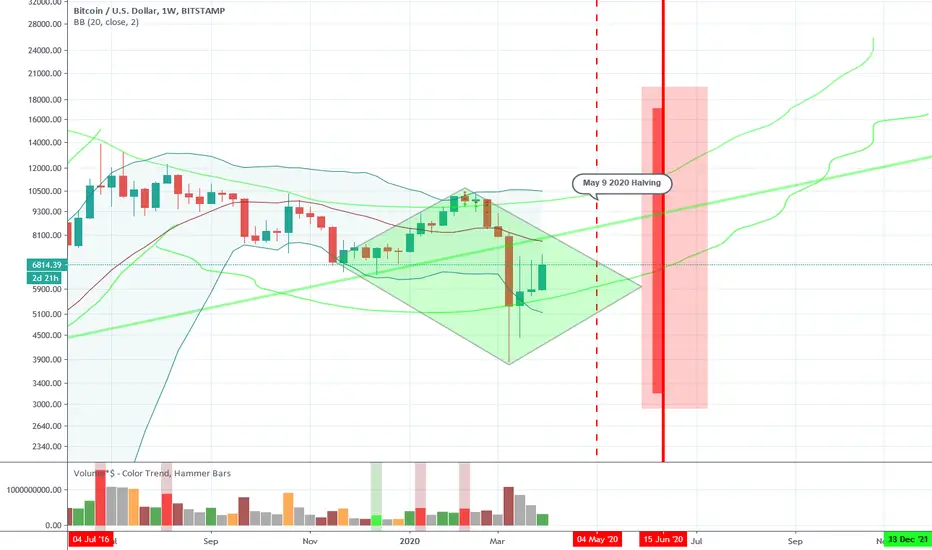
I was looking at allegorycave's chart at 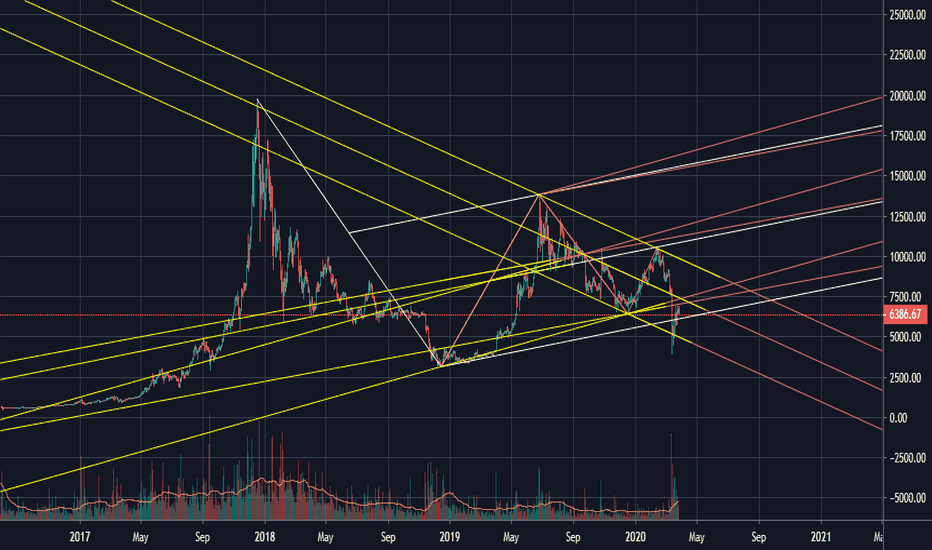 and it occurred to me that we might be building a great big bullish diamond shape.
If it starts to fill in the other half of the diamond that would make it much easier to time the breakout. It seems to be lining up with the expected breakout timeframe after the halving.
Diamonds are typically reversal patterns with a very distinct thrust down the center. Since this was going down on the way in it ought to go up on the way out.
If it starts to fill in the other half of the diamond that would make it much easier to time the breakout. It seems to be lining up with the expected breakout timeframe after the halving.
Diamonds are typically reversal patterns with a very distinct thrust down the center. Since this was going down on the way in it ought to go up on the way out.

関連の投稿
免責事項
これらの情報および投稿は、TradingViewが提供または承認する金融、投資、取引、またはその他の種類の助言もしくは推奨であることを意図したものではなく、またこれらに該当するものでもありません。詳細は利用規約をご覧ください。
免責事項
これらの情報および投稿は、TradingViewが提供または承認する金融、投資、取引、またはその他の種類の助言もしくは推奨であることを意図したものではなく、またこれらに該当するものでもありません。詳細は利用規約をご覧ください。