
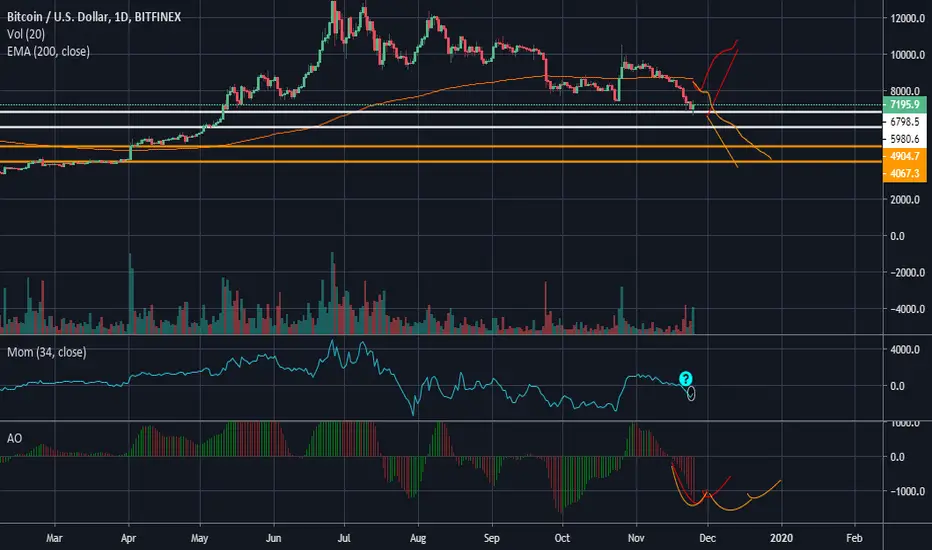
There are two possible outcomes of the recent crash, the same two as always; a further negative price action, or a trend reversal to the upside.
The flat EMA200 is not a very positive omen, typically looks like that when it is about to fall off a cliff with the price.
The horizontal white line is a historic support line (5900-6700USD) and has been tested several times in the past and has only once before been a level of resistance.
The colors represent scenarios, red being to the upside and orange to the downside. Starting from the bottom, the Williams' Awesome Oscillartor (AO) indicates a swing low, which if followed by a higher swing low is a key indicator of a upwards trend that will then show up in the momentum and subsequently the price. However if this second swing is lower than the first that indicates a selloff and will be needed to be followed by a higher swing low to indicate seller exhaustion and a trend reversal.
The confusion comes with that small uptick in momentum diverging from the AO which indicates momentum should still be downwards. Likely just the shorts cashing in from the spike to 10k just 1.5 weeks ago.
The only real question right now however is do you buy now or do you buy in a week? not a bad place to be either way market is going to trend upwards in the long run and we are all still quite early in the game.
Only time will tell.
ノート
How to read AO:tradingstrategyguides.com/bill-williams-awesome-oscillator-strategy/

関連の投稿
免責事項
これらの情報および投稿は、TradingViewが提供または承認する金融、投資、取引、またはその他の種類の助言もしくは推奨であることを意図したものではなく、またこれらに該当するものでもありません。詳細は利用規約をご覧ください。
免責事項
これらの情報および投稿は、TradingViewが提供または承認する金融、投資、取引、またはその他の種類の助言もしくは推奨であることを意図したものではなく、またこれらに該当するものでもありません。詳細は利用規約をご覧ください。