
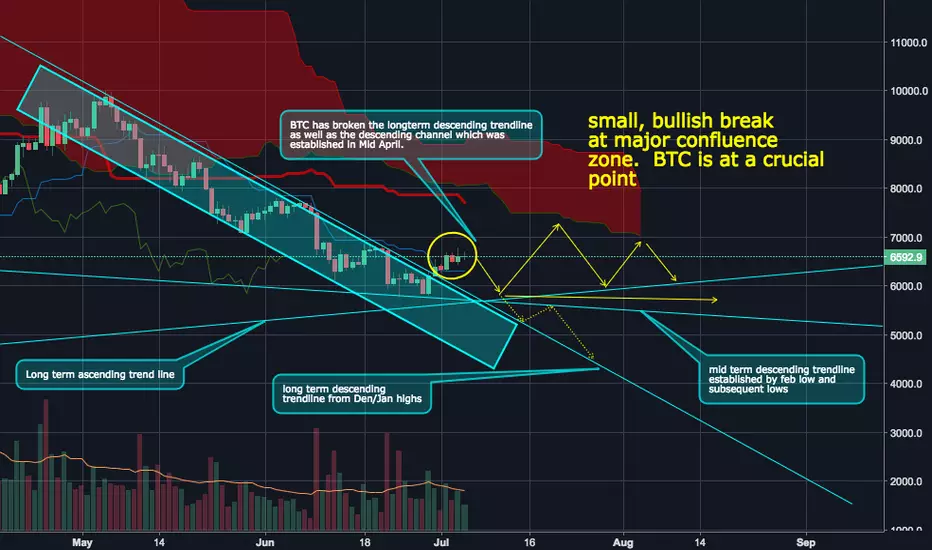
BTC UPDATE: Daily Chart: BTC showing some bullishness on the long chart. The chart below shows a confluence zone where the descending (bearish) trendlines established in December/January and again in february converge wih the much longer term ascending trend line. The lower ascending trendline can be a bit subjective as a new low would simply move it down, so we can't count too much on that until we see more data. The good news is that the recent jump upward has punctured the longer term descending trend line from december/jan highs, which means that--if nothing else--the bearishness is decreasing. We still could be travelling downward, but this is a good sign for the more conservative investor such as myself.

Learn to trade like a hedge fund pro. Send me a message if you have any questions.
免責事項
これらの情報および投稿は、TradingViewが提供または承認する金融、投資、取引、またはその他の種類の助言もしくは推奨であることを意図したものではなく、またこれらに該当するものでもありません。詳細は利用規約をご覧ください。
Learn to trade like a hedge fund pro. Send me a message if you have any questions.
免責事項
これらの情報および投稿は、TradingViewが提供または承認する金融、投資、取引、またはその他の種類の助言もしくは推奨であることを意図したものではなく、またこれらに該当するものでもありません。詳細は利用規約をご覧ください。