
4-hour chart:
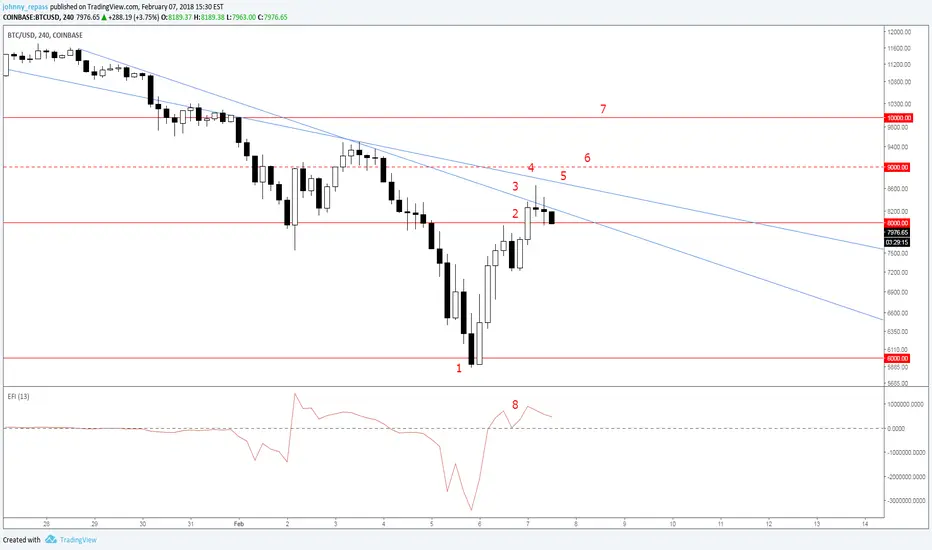
1. Bounced off of support @ 6000
2. Crossed resistance @ 8000
3. Upper trend line resistance (secondary)
4. Bearish pin bar
5. Upper trend line resistance (primary)
6. Weak resistance @ 9000
7. Strong resistance @ 10000
8. Momentum slowing on EFI but no bearish divergence yet
Going long might look temping but price must overcome both primary and secondary upper trend lines, as well as stay above support at 8000. The pin bar (#4) shows that the bears still have control above the secondary trend line. Bullish momentum is also slowing on the EFI.
Scenario 1: Trend overcomes support @8000. Price heads for next support @ 6000. (support might also be found @ around 7k)
Scenario 2: Price overcomes secondary trend line but cannot break primary line.
Scenario 3: The bulls overcome both trend lines. Soon after it is likely to face weak resistance at 9000. To make a higher high, Bitcoin must break 9500 and strong resistance should be expected @ 10000. A clean break of 10000 would be a good sign that the balance of power has shifted.
1. Bounced off of support @ 6000
2. Crossed resistance @ 8000
3. Upper trend line resistance (secondary)
4. Bearish pin bar
5. Upper trend line resistance (primary)
6. Weak resistance @ 9000
7. Strong resistance @ 10000
8. Momentum slowing on EFI but no bearish divergence yet
Going long might look temping but price must overcome both primary and secondary upper trend lines, as well as stay above support at 8000. The pin bar (#4) shows that the bears still have control above the secondary trend line. Bullish momentum is also slowing on the EFI.
Scenario 1: Trend overcomes support @8000. Price heads for next support @ 6000. (support might also be found @ around 7k)
Scenario 2: Price overcomes secondary trend line but cannot break primary line.
Scenario 3: The bulls overcome both trend lines. Soon after it is likely to face weak resistance at 9000. To make a higher high, Bitcoin must break 9500 and strong resistance should be expected @ 10000. A clean break of 10000 would be a good sign that the balance of power has shifted.
ノート
Secondary trend line resistance overcame support @ 8000. ノート
Note the bearish divergence between price and EFIノート
deadlock. so far unable to break resistance but not willing to retreat eitherノート
Pushed past the secondary TL, testing the primary TL. The bearish divergence with EFI continues.
免責事項
これらの情報および投稿は、TradingViewが提供または承認する金融、投資、取引、またはその他の種類の助言もしくは推奨であることを意図したものではなく、またこれらに該当するものでもありません。詳細は利用規約をご覧ください。
免責事項
これらの情報および投稿は、TradingViewが提供または承認する金融、投資、取引、またはその他の種類の助言もしくは推奨であることを意図したものではなく、またこれらに該当するものでもありません。詳細は利用規約をご覧ください。