
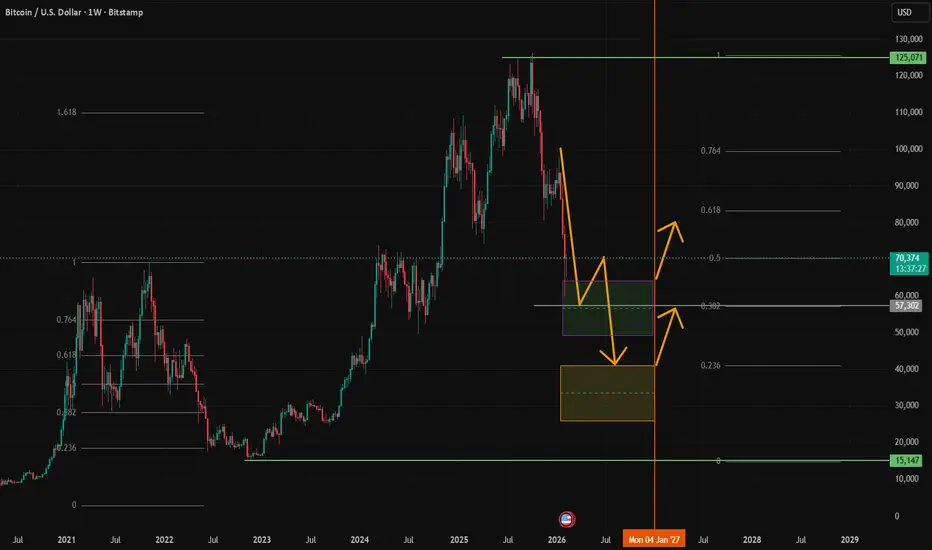
Long term plot, of what would be this 2026 Bear Market
-----------------------------------------------------------------------
Orange lines mark the potential movements across this year.
Proportions of the movement are measured in Fibonacci terms (in gray lines to the right).
Two scenarios are marked with two different colored boxes:
Scenario 1: We stop around the 0.382 Fibonacci level to resume up-trend in 2027.
This scenario is very possible as this cycle topped in apathy, we didn't enter extreme overbought conditions. Therefore, there may be strong potential in retailer demand that never was actioned.
Scenario 2: A brutal winter may drag down BTC to 0.236 Fibonacci level.
Always is possible to go down to extreme oversold levels, maybe even below 0.236. This is a highly volatile asset, extreme moves and black swans are common in this land. Be cautious, always be prepared.
Scenario 3: Not depicted in chart, a rebound from current 0.5 Fibonacci level.
Not my base case, definitely, but one always must consider alternatives: a rebound back to the 100K area may happen. Once there, the most likely is a resume of the Bear Market. Whenever this would be a rebirth of the bull run? I don't think so. We will see.
Disclaimer.
Do your own research. Trade your own plan. This is just a mere opinion and I'm not a professional adviser and this is not a financial advice. Nor I take responsibility for trades of other people.
Good luck everybody!
T.
-----------------------------------------------------------------------
Orange lines mark the potential movements across this year.
Proportions of the movement are measured in Fibonacci terms (in gray lines to the right).
Two scenarios are marked with two different colored boxes:
Scenario 1: We stop around the 0.382 Fibonacci level to resume up-trend in 2027.
This scenario is very possible as this cycle topped in apathy, we didn't enter extreme overbought conditions. Therefore, there may be strong potential in retailer demand that never was actioned.
Scenario 2: A brutal winter may drag down BTC to 0.236 Fibonacci level.
Always is possible to go down to extreme oversold levels, maybe even below 0.236. This is a highly volatile asset, extreme moves and black swans are common in this land. Be cautious, always be prepared.
Scenario 3: Not depicted in chart, a rebound from current 0.5 Fibonacci level.
Not my base case, definitely, but one always must consider alternatives: a rebound back to the 100K area may happen. Once there, the most likely is a resume of the Bear Market. Whenever this would be a rebirth of the bull run? I don't think so. We will see.
Disclaimer.
Do your own research. Trade your own plan. This is just a mere opinion and I'm not a professional adviser and this is not a financial advice. Nor I take responsibility for trades of other people.
Good luck everybody!
T.

免責事項
これらの情報および投稿は、TradingViewが提供または承認する金融、投資、取引、またはその他の種類の助言もしくは推奨であることを意図したものではなく、またこれらに該当するものでもありません。詳細は利用規約をご覧ください。
免責事項
これらの情報および投稿は、TradingViewが提供または承認する金融、投資、取引、またはその他の種類の助言もしくは推奨であることを意図したものではなく、またこれらに該当するものでもありません。詳細は利用規約をご覧ください。