
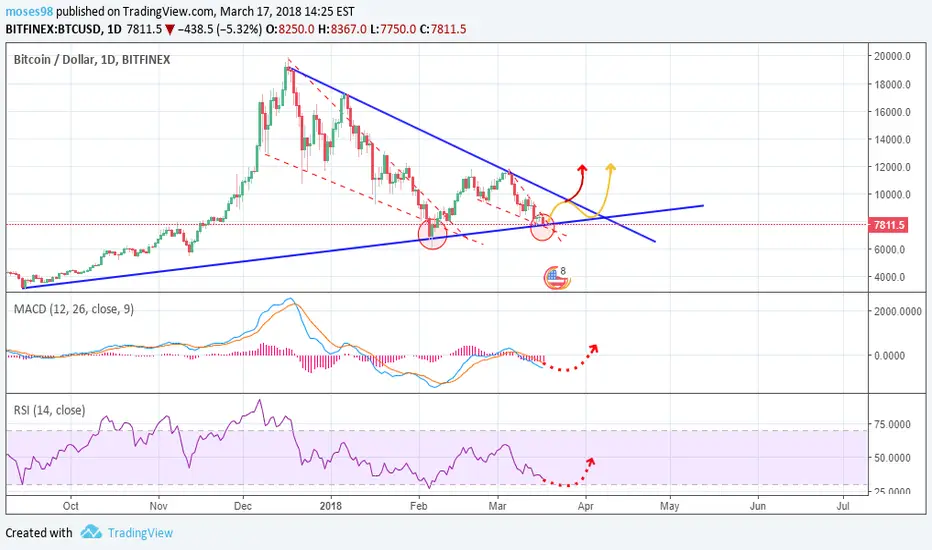
Hello traders! Here we have BTC/USD. As you can see from TA we are fighting with the downtrend resistance line (dotted red line). (red dotted line) is showing a forming a descending wedge'ish pattern - I think, it's more likely, that we will follow this path down to around ~7,300USD levels (red dotted line) and then see a spike in price.
MACD & RSI indicators are starting to gain momentum.
RSI is near oversold mark.
MACD is below average.
MACD & RSI indicators are starting to gain momentum.
RSI is near oversold mark.
MACD is below average.

関連の投稿
免責事項
これらの情報および投稿は、TradingViewが提供または承認する金融、投資、取引、またはその他の種類の助言もしくは推奨であることを意図したものではなく、またこれらに該当するものでもありません。詳細は利用規約をご覧ください。
免責事項
これらの情報および投稿は、TradingViewが提供または承認する金融、投資、取引、またはその他の種類の助言もしくは推奨であることを意図したものではなく、またこれらに該当するものでもありません。詳細は利用規約をご覧ください。