
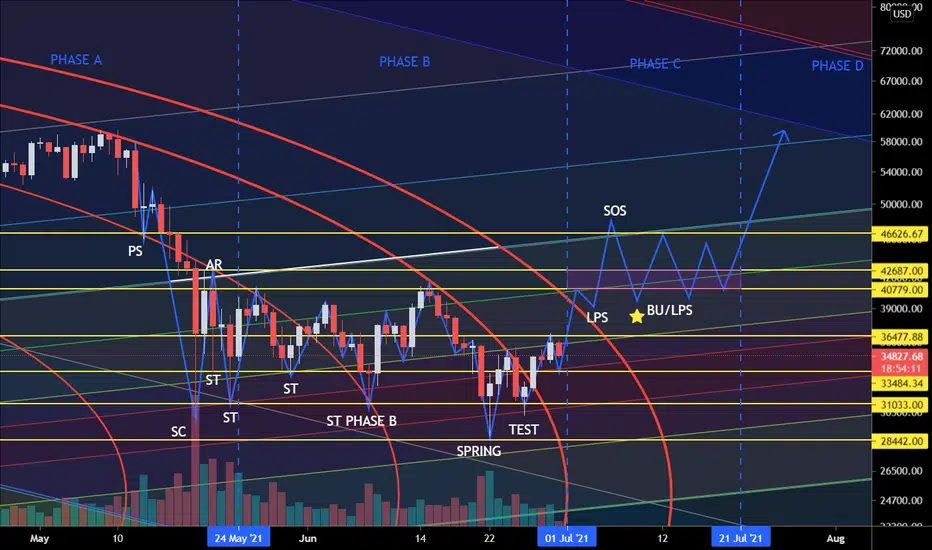
I've combined several ideas from multiple charts into one. Main chart layout uses fib circles created from trend lines and fib channels. Chart has played out nicely so far. I've included a Wyckoff Accumulation layout on top of the chart and so far price has been respecting it nicely. I expect a test of 48K for Bitcoin in the near future. After all Bitcoin will fly in July! Cheers to those who have bought the dip.

免責事項
これらの情報および投稿は、TradingViewが提供または承認する金融、投資、取引、またはその他の種類の助言もしくは推奨であることを意図したものではなく、またこれらに該当するものでもありません。詳細は利用規約をご覧ください。
免責事項
これらの情報および投稿は、TradingViewが提供または承認する金融、投資、取引、またはその他の種類の助言もしくは推奨であることを意図したものではなく、またこれらに該当するものでもありません。詳細は利用規約をご覧ください。