
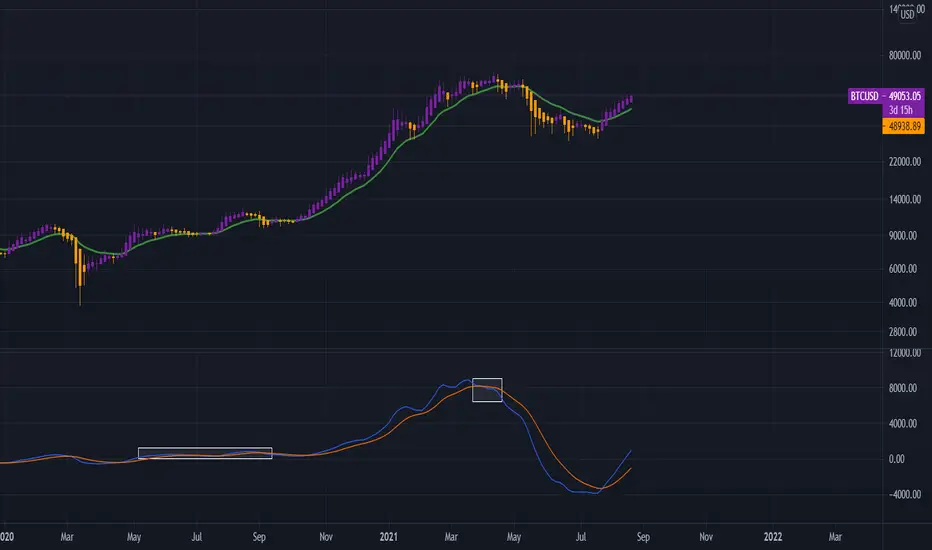
Technically speaking, a strategy for mid-term investment can be a combination of EMA on 4D Heiken Ashi plus the MACD indicator. This EMA has been a good support level since the COVID crash in the #BTC chart. Combining this dynamic support line with the MACD-cross signal, we can derive a reliable buy/sell signal for the mid-term. Considering the discussed MACD/EMA strategy, IMO we are experiencing a market price structure similar to what we saw after COVID crash.

免責事項
これらの情報および投稿は、TradingViewが提供または承認する金融、投資、取引、またはその他の種類の助言もしくは推奨であることを意図したものではなく、またこれらに該当するものでもありません。詳細は利用規約をご覧ください。
免責事項
これらの情報および投稿は、TradingViewが提供または承認する金融、投資、取引、またはその他の種類の助言もしくは推奨であることを意図したものではなく、またこれらに該当するものでもありません。詳細は利用規約をご覧ください。