
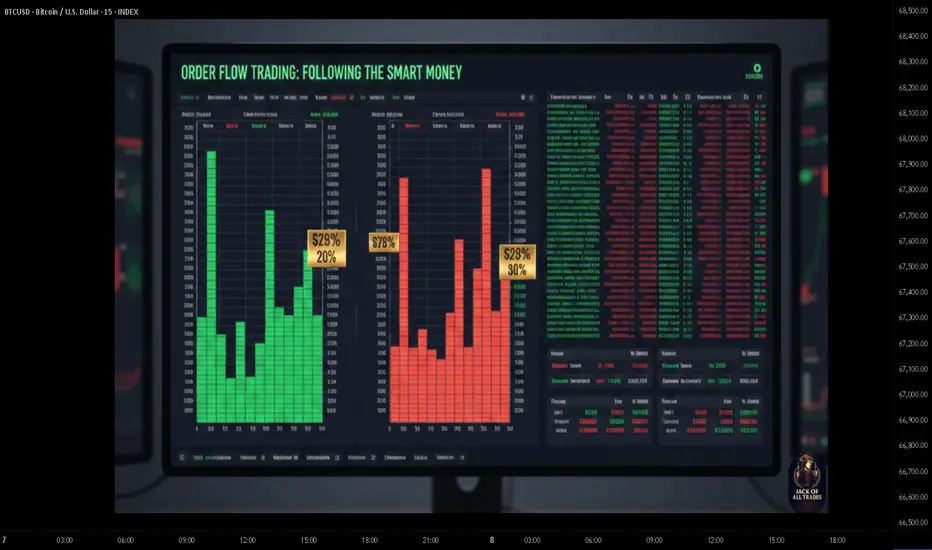
While Everyone Stares at Charts, Smart Traders Watch the Tape.
Charts show you where price has been.
The tape shows you where it's going.
Tape reading and order flow analysis reveal the intentions of big players — before those intentions show up on your chart.
This is how professional traders see what retail traders miss.
What Is Tape Reading?
Definition:
The art of reading Time & Sales (the "tape") and Level 2 (order book) to understand buying and selling pressure in real-time.
What You See:
- Every trade as it happens
- Size of each trade
- Bid and ask orders
- Order book depth
- Large institutional orders
Why It Matters:
Price follows order flow. If you can read order flow, you can anticipate price movement.
Key Components of Order Flow
1. Time & Sales (The Tape)
What It Shows:
- Every executed trade
- Price
- Size
- Time
- Buy or sell side
What to Look For:
- Large trades (institutional)
- Aggressive buying/selling
- Pace of trades
- Absorption (large orders getting filled)
2. Level 2 (Order Book / DOM)
What It Shows:
- All pending buy orders (bids)
- All pending sell orders (asks)
- Order sizes at each price
- Market depth
What to Look For:
- Large orders (walls)
- Order imbalances
- Spoofing (fake orders)
- Support/resistance levels
3. Footprint Charts
What It Shows:
- Volume traded at each price level
- Buy vs sell volume
- Imbalances
- Delta (buy volume - sell volume)
What to Look For:
- Volume clusters
- Absorption
- Exhaustion
- Imbalances
Reading Order Flow Signals
Signal 1: Large Orders (Icebergs)
What It Is:
Large institutional order being filled in pieces
How to Spot:
- Same price level keeps getting hit
- Large volume at one price
- Order book refreshes at same level
Interpretation:
- Large buyer at support = Bullish
- Large seller at resistance = Bearish
- Absorption happening
Signal 2: Order Book Imbalance
What It Is:
Significantly more buy orders than sell orders (or vice versa)
How to Spot:
- Bid side stacked with orders
- Ask side thin
- Or opposite
Interpretation:
- Heavy bid side = Support, potential bounce
- Heavy ask side = Resistance, potential rejection
Signal 3: Aggressive Buying/Selling
What It Is:
Market orders hitting the ask (buying) or bid (selling) aggressively
How to Spot:
- Rapid trades on tape
- Large market orders
- Price moving quickly
Interpretation:
- Aggressive buying = Bullish momentum
- Aggressive selling = Bearish momentum
- Follow the aggression
Signal 4: Absorption
What It Is:
Large orders absorbing all incoming volume without price moving
How to Spot:
- High volume at one price
- Price not moving
- Large orders being filled
Interpretation:
- Absorption at support = Strong buyers, likely bounce
- Absorption at resistance = Strong sellers, likely rejection
Signal 5: Spoofing (Fake Orders)
What It Is:
Large orders placed to manipulate perception, then cancelled
How to Spot:
- Large order appears
- Price moves toward it
- Order disappears before being filled
Interpretation:
- Manipulation
- Don't trust the order
- Watch for cancellations
Note:
Spoofing is illegal but still happens
Tape Reading Strategies
Strategy 1: Iceberg Order Fade
Setup:
- Identify large iceberg order at support
- Price tests the level
- Order absorbs selling
- Enter long on bounce
Logic:
Large buyer defending level = Support
Strategy 2: Imbalance Breakout
Setup:
- Price at resistance
- Order book shows heavy bid side
- Aggressive buying on tape
- Enter long on break
Logic:
Imbalance + aggression = Breakout likely
Strategy 3: Absorption Reversal
Setup:
- Price rallying
- Hits resistance
- Large volume absorbed
- Price stops moving up
- Enter short
Logic:
Absorption at resistance = Sellers in control
Strategy 4: Delta Divergence
Setup:
- Price making new high
- Delta (buy volume - sell volume) decreasing
- Divergence
- Enter short
Logic:
Weakening buying pressure = Reversal coming
Order Flow Indicators
1. Cumulative Delta
- Running total of buy volume - sell volume
- Shows overall pressure
- Divergence signals reversals
2. Volume Profile
- Volume at each price level
- Shows acceptance/rejection
- POC, VAH, VAL
3. Market Profile
- Time spent at each price
- Value areas
- Market structure
4. Bid/Ask Volume
- Real-time buy vs sell volume
- Imbalances
- Momentum shifts
Best Markets for Tape Reading
Futures:
- ES (S&P 500)
- NQ (Nasdaq)
- Best liquidity
- Clear order flow
- Professional tools available
Stocks:
- High-volume stocks only
- AAPL, TSLA, SPY
- Level 2 available
- More fragmented (multiple exchanges)
Forex:
- Decentralized market
- No true order book
- Limited tape reading
- Use volume analysis instead
Crypto:
- Exchange-specific order books
- High manipulation
- Spoofing common
- Use with caution
Tools for Order Flow Trading
Professional Platforms:
1. Sierra Chart
- Footprint charts
- Order flow tools
- Professional grade
- $36/month
2. Jigsaw Trading
- Depth & Sales
- Reconstruction
- Specialized for tape reading
- $297/month
3. Bookmap
- Heatmap visualization
- Order flow
- Liquidity tracking
- $99+/month
4. NinjaTrader
- Order flow tools
- Footprint charts
- Free (with data fees)
Learning Tape Reading
Step 1: Watch Without Trading
- Open Time & Sales
- Open Level 2
- Watch for 30 minutes
- Note patterns
Step 2: Identify Large Orders
- What size is "large" for your market?
- Watch how price reacts
- Note absorption
Step 3: Correlate with Price
- Watch tape and chart together
- See how order flow leads price
- Identify patterns
Step 4: Paper Trade
- Practice reading signals
- No real money yet
- Build pattern recognition
Step 5: Start Small
- Trade smallest size
- Focus on reading, not profit
- Build confidence
Common Tape Reading Mistakes
- Information Overload — Too much data. Focus on key signals only.
- Chasing Every Signal — Not every order flow signal is tradeable. Be selective.
- Ignoring Context — Order flow without chart context is incomplete. Use both.
- Trusting Spoofed Orders — Large orders can be fake. Watch for cancellations.
- Wrong Market — Tape reading works best in liquid futures. Choose right market.
- No Practice — Tape reading is a skill. Requires screen time to develop.
Combining Tape Reading with Technical Analysis
Best Approach:
Use both together
Technical Analysis:
- Identifies key levels
- Shows overall structure
- Provides context
Tape Reading:
- Confirms at key levels
- Shows real-time pressure
- Provides entry timing
Example:
- Chart shows support level
- Price approaches support
- Tape shows large buyer absorbing
- Enter long with confirmation
Key Takeaways
- Tape reading shows real-time buying and selling pressure
- Time & Sales and Level 2 reveal institutional activity
- Large orders, imbalances, and absorption are key signals
- Best for liquid futures markets (ES, NQ)
- Requires practice and screen time to master
Your Turn
Do you use tape reading or order flow analysis?
What platform do you use for order flow?
What's the most valuable order flow signal you've learned?
Share your tape reading experience below 👇

The AI Trading Ecosystem, Built to win trades 📈
Get Full Access 👇
jackofalltrades.vip 🌐
t.me/jackofalltradesvip 🃏
Get Full Access 👇
jackofalltrades.vip 🌐
t.me/jackofalltradesvip 🃏
免責事項
これらの情報および投稿は、TradingViewが提供または承認する金融、投資、取引、またはその他の種類の助言もしくは推奨であることを意図したものではなく、またこれらに該当するものでもありません。詳細は利用規約をご覧ください。
The AI Trading Ecosystem, Built to win trades 📈
Get Full Access 👇
jackofalltrades.vip 🌐
t.me/jackofalltradesvip 🃏
Get Full Access 👇
jackofalltrades.vip 🌐
t.me/jackofalltradesvip 🃏
免責事項
これらの情報および投稿は、TradingViewが提供または承認する金融、投資、取引、またはその他の種類の助言もしくは推奨であることを意図したものではなく、またこれらに該当するものでもありません。詳細は利用規約をご覧ください。