
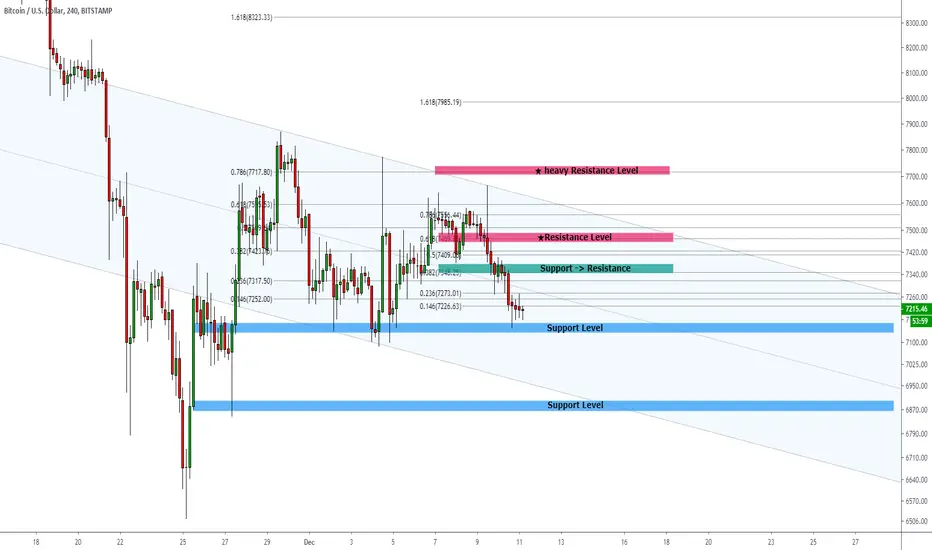
Sell signal showed up in daily candle.
After the Double-Top, the 1st support level was broken.
In 4-hr chart, the support level and higher have become the Key Resistance Level .
Based on the downward channel and parallel line, if the 1st Support Level is broken then the price would drop to the 2nd Support Level .
After the Double-Top, the 1st support level was broken.
In 4-hr chart, the support level and higher have become the Key Resistance Level .
Based on the downward channel and parallel line, if the 1st Support Level is broken then the price would drop to the 2nd Support Level .
ノート

免責事項
これらの情報および投稿は、TradingViewが提供または承認する金融、投資、取引、またはその他の種類の助言もしくは推奨であることを意図したものではなく、またこれらに該当するものでもありません。詳細は利用規約をご覧ください。
免責事項
これらの情報および投稿は、TradingViewが提供または承認する金融、投資、取引、またはその他の種類の助言もしくは推奨であることを意図したものではなく、またこれらに該当するものでもありません。詳細は利用規約をご覧ください。