
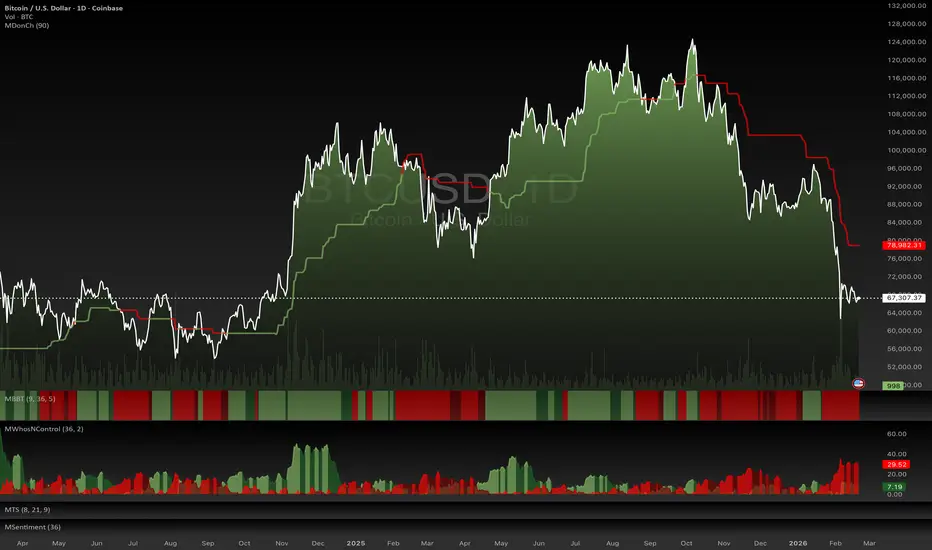
Bitcon has been able to find a support in the 60K area. This helps to build momentum. We can’t say the selloff is over, since there are a couple of things that have to happen first, the first one is the dead cat bounce or technically speaking, the relief rally, which will push it probably to the previous support at the 80K level, and secondly, a fall back to the 70K, or 60K levels, where we’ll see if this was able to build enough support.
The two indicators displayed are:
1. Bull/Bear Territory, which displays in simple terms how the trend is behaving. This one shows a Bear territory, which is confirmed by the Donchian channel in the chart. The prices are below the midline.
2. The “WhosinControl” indicator which shows the balance leans towards the bears. It’s not over yet. This indicator will show when the balance of power points toward the Bull side again, and that could setup an interesting trade to take advantage of the relief rally, setting a target towards the previous support.
The two indicators displayed are:
1. Bull/Bear Territory, which displays in simple terms how the trend is behaving. This one shows a Bear territory, which is confirmed by the Donchian channel in the chart. The prices are below the midline.
2. The “WhosinControl” indicator which shows the balance leans towards the bears. It’s not over yet. This indicator will show when the balance of power points toward the Bull side again, and that could setup an interesting trade to take advantage of the relief rally, setting a target towards the previous support.

関連の投稿
免責事項
これらの情報および投稿は、TradingViewが提供または承認する金融、投資、取引、またはその他の種類の助言もしくは推奨であることを意図したものではなく、またこれらに該当するものでもありません。詳細は利用規約をご覧ください。
免責事項
これらの情報および投稿は、TradingViewが提供または承認する金融、投資、取引、またはその他の種類の助言もしくは推奨であることを意図したものではなく、またこれらに該当するものでもありません。詳細は利用規約をご覧ください。