
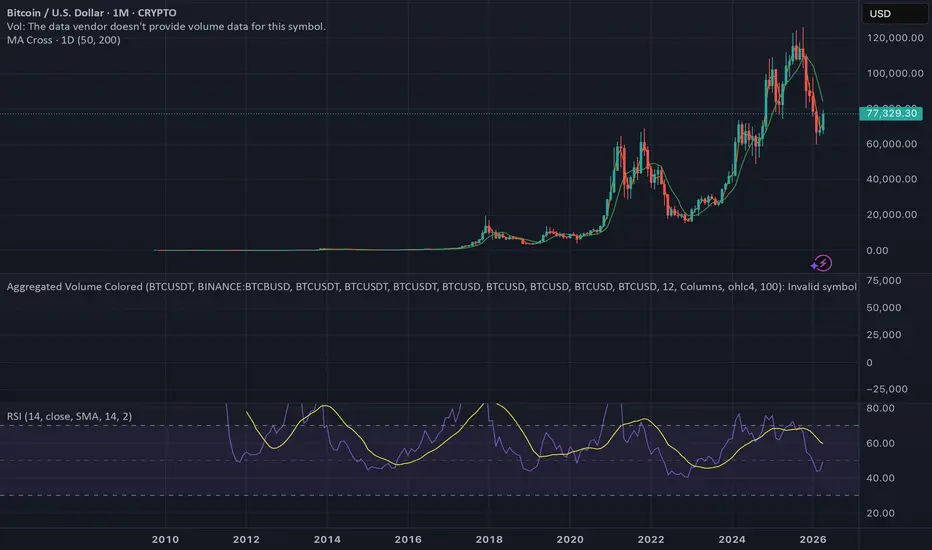
BITCOIN'S DEMAND DIFFERENTIAL: A STRUCTURAL DERIVATION, NOT A PRICE PREDICTION
Disclosure: I hold Bitcoin. This is not financial advice. This is a structural model derived entirely from public, sourced data. All formulas are shown. All inputs are cited. You can reproduce every number yourself. Falsification conditions are listed at the end. If those conditions are met, the model is wrong. That is the point.
───────────────────────────────────────────
WHAT THIS IS
Most Bitcoin analysis asks: where is price going?
This article asks a different question: what does the arithmetic of supply and demand actually show, without opinion?
The answer is a demand differential model — the measured difference between how much Bitcoin is being demanded at each stage of institutional adoption versus how much is structurally available to be sold. When you run the numbers from observable on-chain data, a specific and calculable structure emerges.
This is not a bull case. It is not a bear case. It is arithmetic applied to sourced, observable data. Substitute your own inputs. The formulas are shown.
───────────────────────────────────────────
PART 1: THE SELL SIDE — WHAT IS STRUCTURALLY AVAILABLE
Before modeling demand, you need to know what supply actually looks like. Three sources.
SOURCE 1 — MINING NEW ISSUANCE (protocol-enforced, immutable)
Pre-May 2020 halving: 1,800 BTC/day
May 2020 – Apr 2024: 900 BTC/day
Apr 2024 – Apr 2028: 450 BTC/day ← current
Apr 2028 – Apr 2032: 225 BTC/day
Apr 2032 – Apr 2036: 113 BTC/day
This number only goes down. It halves every four years without exception. It is written into the protocol. No market force can increase it.
SOURCE 2 — MINER TREASURY LIQUIDATION (temporary, fading)
Public miners sold 32,000 BTC in Q1 2026 — more than all of 2025 — due to post-halving margin compression. That is approximately 355 BTC/day from public miners alone. Accounting for private miners (roughly 50% of hash rate), total miner selling runs approximately 710 BTC/day currently.
Sources: Blockonomi, CoinTelegraph, CryptoSlate, CoinShares Q1 2026 Report
This is a stress-peak figure. Multiple sources note this selling is approaching exhaustion as the least efficient miners shut down or pivot to AI compute. Miner treasury reserves have declined from approximately 1.86M BTC in 2023 to approximately 1.8M BTC in Q2 2026. The treasury is finite and being drawn down.
SOURCE 3 — LONG-TERM HOLDER PROFIT-TAKING (residual, small)
Long-term holders (LTH) currently control approximately 75% of circulating supply, roughly 14.8M BTC. Historical LTH sell rates in non-peak periods run 0.1 to 0.3% of holdings per year — approximately 40 to 120 BTC/day. Using 100 BTC/day as a conservative steady-state estimate.
TOTAL STRUCTURAL SELL SIDE:
Current 2026:
New mining issuance: 450 BTC/day
Miner treasury (elevated): 710 BTC/day
LTH profit-taking: 100 BTC/day
TOTAL: 1,260 BTC/day
Projected 2027 (miner selling fades):
New mining issuance: 450 BTC/day
Miner treasury (fading): 200 BTC/day
LTH profit-taking: 100 BTC/day
TOTAL: 750 BTC/day
Post-2028 halving:
New mining issuance: 225 BTC/day
Miner treasury (minimal): 50 BTC/day
LTH profit-taking: 100 BTC/day
TOTAL: 375 BTC/day
The sell side is permanently and deterministically declining. This is not an opinion. It is a protocol schedule.
───────────────────────────────────────────
PART 2: THREE DEMAND ERAS — DERIVED FROM OBSERVED EXCHANGE DEPLETION
Key methodological principle: exchange reserve depletion rate equals total demand minus total supply reaching exchanges. This means the net demand differential can be derived directly from on-chain observable data without estimating anything. The observed depletion rate is the net demand differential.
Exchange reserves peaked at approximately 3.2M BTC in 2023. They currently sit at approximately 2.25M BTC — an 18-year low.
Sources: SpotedCrypto, ValueTheMarkets
───────────────────────────────────────────
ERA 0 — PRE-INSTITUTIONAL BASELINE (before August 2020)
Observation: Exchange reserves stable at 3.1 to 3.2M BTC for approximately two years. No persistent depletion trend.
Derived net demand differential: approximately 0 BTC/day (near equilibrium)
Gross demand approximately equaled gross supply. Mining issuance of 1,800 BTC/day was absorbed by organic retail demand at roughly the same rate. The market was balanced between traders, early adopters, and sellers.
Sources: Finbold, AMBCrypto
───────────────────────────────────────────
ERA 1 — EARLY INSTITUTIONAL PHASE (August 2020 to January 2024)
Observed data:
Start reserves: approximately 3.1M BTC (Aug 2020)
End reserves: approximately 2.5M BTC (Jan 2024)
Delta: 600,000 BTC depleted
Time: 1,245 days
Calculation (reproducible):
Net drain rate = 600,000 divided by 1,245 days = 481 BTC/day
Gross demand = 481 (net drain) + 900 (mining supply) = 1,381 BTC/day
DERIVED NET DEMAND DIFFERENTIAL: 481 BTC/day
This era was not primarily a demand explosion. It was the May 2020 halving cutting supply from 1,800 to 900 BTC/day that created a structural deficit against relatively stable gross demand, amplified by systematic corporate treasury accumulation — MicroStrategy, Tesla, Square, and a growing class of corporate buyers. The supply halved. Demand held. The deficit began.
───────────────────────────────────────────
ERA 2 — TIER 1 FULL INSTITUTIONAL (January 2024 to Present)
Observed data:
Peak reserves (2023): approximately 3.2M BTC
Current reserves (Apr 2026): approximately 2.25M BTC
Delta: 950,000 BTC depleted
Time: approximately 1,095 days
Calculation (reproducible):
Net drain rate = 950,000 divided by 1,095 days = 868 BTC/day
ETF verification:
All U.S. spot Bitcoin ETFs combined have averaged 900 to 950 BTC/day absorbed through 2024 and into 2026. On April 26, 2026: 932.7 BTC net inflow recorded in a single day.
Sources: Newhedge (daily ETF flow tracker), Gate.io Bitcoin ETF tracker
BlackRock IBIT alone holds approximately 802,000 BTC accumulated over approximately 820 days, which equals roughly 978 BTC/day absorbed. IBIT alone is absorbing more than double the total daily new mining supply of 450 BTC/day.
DERIVED NET DEMAND DIFFERENTIAL: 868 BTC/day
This number is not an estimate. It is the measured rate of exchange reserve depletion. It is what is happening right now, in real time, without any further regulatory unlock. No CLARITY Act. No pension funds. No 401k plans. No insurance reserves. Just ETFs, corporate treasuries, and wealth management.
───────────────────────────────────────────
PART 3: THE STRUCTURAL DEMAND FLOOR
Not all demand is discretionary. Some is structurally committed and cannot be withdrawn without the accumulating entities violating their own stated investment mandates.
Structural floor components:
ETF mechanical inflows (minimum): 300 BTC/day
Strategy systematic DCA: 150 BTC/day
Other corporate treasury (160+ firms): 100 BTC/day
Organic retail HODLer base: 100 BTC/day
International institutional (EU, Asia): 100 BTC/day
TOTAL GROSS FLOOR: 750 BTC/day
Net structural floor calculation:
Gross demand floor: 750 BTC/day
New issuance floor: 450 BTC/day
NET FLOOR: 300 BTC/day
This 300 BTC/day floor cannot reach zero while the current institutional paradigm exists. It requires Strategy to liquidate its entire position, all ETFs to simultaneously see persistent outflows, and all international institutional activity to stop. The data shows no indication of any of these conditions.
NATURAL ERA 2 ACCELERATION COMING — WITHOUT ANY NEW DEMAND:
As miner treasury selling fades from approximately 710 BTC/day toward approximately 200 BTC/day through 2027, the net drain rate increases by approximately 510 BTC/day with zero change in demand. ERA 2 naturally accelerates from 868 BTC/day toward approximately 1,250 BTC/day net drain purely as a function of the miner stress cycle resolving.
───────────────────────────────────────────
PART 4: WHAT IS CURRENTLY LOCKED OUT OF THE MARKET
This is the variable most public analysis is missing.
WHAT HAS PASSED:
The GENIUS Act (stablecoin regulation) was signed into law July 18, 2025 — Public Law 119-27. Source: Congress.gov. This legitimizes the payment stablecoin ecosystem and the rails adjacent to Bitcoin but does not directly unlock institutional Bitcoin demand.
WHAT HAS NOT PASSED:
The Digital Asset Market Clarity Act (CLARITY Act) — which provides the regulatory safe harbor required for U.S. pension funds, 401k plans, insurance reserves, and bank custody products to formally allocate to Bitcoin.
Current status as of April 27, 2026: stalled in the Senate. Primary blocker is a dispute over whether stablecoins can pay yield to holders — a fight between banks and the crypto industry that has nothing to do with Bitcoin's classification. Bitcoin's commodity classification under the bill is not in dispute.
Critical deadline: Senator Moreno's end-of-May ultimatum. If no Senate floor vote by the Memorial Day recess (May 21, 2026), the bill is likely shelved until at least 2030 per multiple legislative analysts. Prediction market odds of 2026 passage: 50 to 72%.
Sources: GreyJournal, Disruption Banking (April 23, 2026), Galaxy Research
THE RESTRICTED CAPITAL POOL:
U.S. pension funds: approximately $40 trillion AUM (ICI 2025)
401k market: approximately $10 trillion AUM (ICI 2025)
Insurance reserves: approximately $8 trillion AUM (NAIC 2025)
University endowments: approximately $800 billion AUM (NACUBO 2025)
U.S.-aligned sovereign wealth: approximately $2 trillion AUM (various)
TOTAL RESTRICTED POOL: approximately $60.8 trillion
Key data point: Coinbase and Parthenon survey, March 2026 — 65% of institutional investors cite regulatory clarity as the primary trigger for increasing crypto allocations.
This demand is not hypothetical. It is explicitly waiting behind a specific regulatory gate.
The ERA 2 accumulation happening right now — 868 BTC/day net drain — is occurring entirely without this capital pool participating.
───────────────────────────────────────────
PART 5: ERA 3 DEMAND DIFFERENTIAL — THREE SCENARIOS
Formula (reproducible):
T2 Daily BTC = (AUM times Allocation%) divided by (Pipeline Years times 365 times BTC Price)
ERA3 Net Drain = ERA2 Net Drain + T2 Daily BTC addition
Allocation scenarios are consistent with gold ETF adoption precedent of 1 to 3% allocation in the first 5 years following institutional unlock:
CONSERVATIVE SCENARIO (1% of AUM, 5-year pipeline):
Dollar allocation: $608 billion
Daily BTC demand added at $77,000: 4,327 BTC/day
ERA3 total net drain: approximately 4,817 BTC/day
Multiplier vs ERA2: 5.5 times
MODERATE SCENARIO (2% of AUM, 3-year pipeline):
Dollar allocation: $1.216 trillion
Daily BTC demand added at $77,000: 14,422 BTC/day
ERA3 total net drain: approximately 14,930 BTC/day
Multiplier vs ERA2: 17.2 times
AGGRESSIVE SCENARIO (5% of AUM, 2-year pipeline):
Dollar allocation: $3.04 trillion
Daily BTC demand added at $77,000: 54,083 BTC/day
ERA3 total net drain: approximately 54,591 BTC/day
Multiplier vs ERA2: 62.9 times
Note on price: As price rises, the same dollar allocation acquires fewer BTC. These figures represent the demand volume that attempts to enter at current prices. The market price-rations the demand upward. This is precisely the mechanism by which price must rise to create balance — not speculation, but arithmetic.
───────────────────────────────────────────
PART 6: EXCHANGE DEPLETION TIMELINE
Formula (reproducible):
Days to threshold = (Exchange Reserve minus Threshold) divided by Net Daily Drain
Starting point: 2,250,000 BTC on exchanges. April 27, 2026.
Critical thresholds:
1,500,000 BTC — price action amplifies significantly
1,000,000 BTC — severe liquidity constraint
500,000 BTC — structural impossibility at current prices
TIME TO 1,500,000 BTC THRESHOLD:
Structural floor (300/day): 833 days → March 2029
ERA 2 current (868/day): 288 days → January 2027
ERA 2 accelerated (1,250/day): 200 days → November 2026
ERA 3 Conservative (4,817/day): 156 days → October 2026
ERA 3 Moderate (14,930/day): 50 days → June 2026
ERA 3 Aggressive (54,591/day): 14 days → May 2026
TIME TO 1,000,000 BTC THRESHOLD:
Structural floor (300/day): 4,167 days → January 2038
ERA 2 current (868/day): 865 days → September 2028
ERA 2 accelerated (1,250/day): 600 days → December 2027
ERA 3 Conservative (4,817/day): 260 days → January 2027
ERA 3 Moderate (14,930/day): 84 days → July 2026
ERA 3 Aggressive (54,591/day): 23 days → May 2026
IMPORTANT INTERPRETATION NOTE:
These timelines do not represent when exchanges literally empty. They represent when the market becomes structurally forced to price-discover upward — when a single large institutional purchase cannot be filled by available exchange liquidity without significant price impact. The response begins before the threshold, not at it.
At 1.5M BTC on exchanges, a $1 billion institutional purchase at $77,000 equals approximately 13,000 BTC, which is 0.87% of remaining exchange supply versus 0.58% today. Price sensitivity to large purchases scales inversely with available liquidity. The supply shock accelerates as the denominator shrinks.
───────────────────────────────────────────
PART 7: THE STRUCTURAL EQUILIBRIUM BRACKET
At some price level, demand is rationed and existing holder supply is unlocked — a new equilibrium forms. This price is calculable within a bracket.
LTH supply potentially unlockable at each price level (estimated from cost basis distribution):
At $100,000: approximately 60% of 14.8M LTH supply willing to sell = 8.9M BTC
Total available (exchange plus LTH): approximately 11.1M BTC
At $150,000: approximately 75% of 14.8M LTH supply willing to sell = 11.1M BTC
Total available: approximately 13.4M BTC
At $200,000: approximately 85% of 14.8M LTH supply willing to sell = 12.6M BTC
Total available: approximately 14.8M BTC
Demand vs. unlockable supply by scenario:
CONSERVATIVE ($608B total T2 demand):
BTC demanded at $100,000: 6.1M BTC
BTC available at $100,000: 11.1M BTC
Balance achievable at approximately $100,000
Equilibrium bracket: $100,000 to $130,000
MODERATE ($1.216T total T2 demand):
BTC demanded at $150,000: 8.1M BTC
BTC available at $150,000: 13.4M BTC
Balance achievable at approximately $150,000
Equilibrium bracket: $140,000 to $180,000
AGGRESSIVE ($3.04T total T2 demand):
BTC demanded at $250,000: 12.2M BTC
BTC available at $250,000: approximately 16M BTC
Balance achievable at approximately $250,000
Equilibrium bracket: $200,000 to $300,000 and above
CROSS-CHECK AGAINST MAJOR INSTITUTIONAL FORECASTS:
Standard Chartered: $100,000 to $200,000 → Conservative to Moderate
JP Morgan: approximately $170,000 → Moderate
Bernstein: $150,000 to $200,000 → Moderate to Aggressive
Citi / Goldman / Fundstrat: $200,000 to $250,000 → Aggressive
These institutions are not publishing price targets arbitrarily. They are running demand models against supply constraints. The brackets produced by independent first-principles derivation converge with their published targets.
Current price of approximately $77,000 sits below the conservative structural equilibrium bracket of $100,000 to $130,000. This means at any level of Tier 2 activation, current price is structurally below the point where supply and demand can balance.
───────────────────────────────────────────
PART 8: THE STALL AS A COMPRESSION EVENT
The CLARITY Act stall is commonly framed as a negative. Structurally, it is not.
The stall does not prevent ERA 2 demand (868 BTC/day) from continuing. Exchange reserves are at 18-year lows despite the stall. The stall only prevents the Tier 2 capital pool from participating.
What the stall is doing:
— ERA 2 accumulation continues depleting exchange supply at 868 BTC/day
— Tier 2 demand accumulates behind the regulatory gate
— Every month of stall depletes approximately 26,000 more BTC from exchanges
— The supply environment that Tier 2 enters upon unlock becomes progressively more constrained
The longer the stall, the more depleted the supply that Tier 2 encounters upon entry.
The delay amplifies the magnitude of the eventual structural event. It does not prevent it.
Scenario comparison:
CLARITY passes May 2026 (R1):
Tier 2 enters against approximately 2.1 to 2.2M BTC exchange supply
Conservative equilibrium: $100,000 to $130,000 range
CLARITY passes 2027 (R2):
ERA 2 depletion continues at 868 to 1,250 BTC/day for 12 more months
Tier 2 enters against approximately 1.0 to 1.5M BTC exchange supply
Moderate equilibrium: $150,000 to $300,000 range
The delay produced a larger structural event on a longer timeline.
───────────────────────────────────────────
THE FOUR NUMBERS
From this entire derivation, four numbers emerge that require no opinion:
NUMBER 1 — THE STRUCTURAL FLOOR NET DRAIN: 300 BTC/day
The minimum net drain under maximum demand pessimism. Direction is fixed in all scenarios. The exchange reserve can only go one direction from here.
NUMBER 2 — THE ERA 2 OBSERVED NET DRAIN: 868 BTC/day
Not estimated. The measured rate of exchange reserve depletion over 1,095 days. This will naturally accelerate toward approximately 1,250 BTC/day as miner treasury selling exhausts — with zero new demand required.
NUMBER 3 — THE CLARITY ACT DEMAND MULTIPLIER: 5.5 to 62.9 times ERA 2
Even the conservative Tier 2 scenario (1% of $60.8 trillion over 5 years) produces 5.5 times the current observed net drain rate.
NUMBER 4 — THE STRUCTURAL EQUILIBRIUM BRACKET: $100,000 to $300,000 and above
The price range at which Tier 2 demand can be rationed against unlockable LTH supply. Current price of approximately $77,000 is below the floor of the conservative bracket in every Tier 2 scenario.
───────────────────────────────────────────
FALSIFICATION CONDITIONS
This model is wrong if any of the following occur:
— Exchange reserves stabilize or increase persistently despite confirmed ongoing institutional accumulation
— ERA 2 net drain drops below the structural floor of 300 BTC/day while institutional mandates remain in place
— Strategy or BlackRock IBIT begin net distribution of their positions at scale
— The CLARITY Act fails permanently AND EU MiCA and Asian regulatory frameworks also fail to unlock equivalent Tier 2 capital globally
— A competing protocol captures the majority of institutional allocation demand at the expense of Bitcoin
— The Bitcoin mining protocol changes its issuance schedule (cryptographically and socially not possible)
If these conditions are not met, the structural direction holds. Timing and magnitude remain variables. Direction does not.
───────────────────────────────────────────
WHAT THIS IS NOT
This is not a call to buy Bitcoin.
This is not a price prediction.
This is not investment advice.
I hold Bitcoin. That is a conflict of interest you should know about.
This is a demand differential model showing, from sourced and auditable public data, that the gap between structural sell-side supply and institutional-era buy-side demand has been persistently and measurably positive since 2020, that it is widening, and that a significant additional demand pool is waiting behind a regulatory gate with a calculable and near-term opening window.
Substitute your own inputs. The formulas are shown.
───────────────────────────────────────────
KEY SOURCES
Exchange reserve data: SpotedCrypto, ValueTheMarkets, Finbold, AMBCrypto, Grokipedia
ETF flows: Newhedge, Gate.io Bitcoin ETF tracker, WalletPilot
Miner selling: Blockonomi, CoinTelegraph, CryptoSlate, CoinShares Q1 2026
Regulatory status: Congress.gov (GENIUS Act), GreyJournal, Disruption Banking, Galaxy Research
Restricted capital AUM: ICI 2025, NAIC 2025, NACUBO 2025
Institutional forecasts: Standard Chartered, JP Morgan, Bernstein, Citi, Goldman, Fundstrat
All formulas reproducible. All inputs cited. All falsification conditions named.
Disclosure: I hold Bitcoin. This is not financial advice. This is a structural model derived entirely from public, sourced data. All formulas are shown. All inputs are cited. You can reproduce every number yourself. Falsification conditions are listed at the end. If those conditions are met, the model is wrong. That is the point.
───────────────────────────────────────────
WHAT THIS IS
Most Bitcoin analysis asks: where is price going?
This article asks a different question: what does the arithmetic of supply and demand actually show, without opinion?
The answer is a demand differential model — the measured difference between how much Bitcoin is being demanded at each stage of institutional adoption versus how much is structurally available to be sold. When you run the numbers from observable on-chain data, a specific and calculable structure emerges.
This is not a bull case. It is not a bear case. It is arithmetic applied to sourced, observable data. Substitute your own inputs. The formulas are shown.
───────────────────────────────────────────
PART 1: THE SELL SIDE — WHAT IS STRUCTURALLY AVAILABLE
Before modeling demand, you need to know what supply actually looks like. Three sources.
SOURCE 1 — MINING NEW ISSUANCE (protocol-enforced, immutable)
Pre-May 2020 halving: 1,800 BTC/day
May 2020 – Apr 2024: 900 BTC/day
Apr 2024 – Apr 2028: 450 BTC/day ← current
Apr 2028 – Apr 2032: 225 BTC/day
Apr 2032 – Apr 2036: 113 BTC/day
This number only goes down. It halves every four years without exception. It is written into the protocol. No market force can increase it.
SOURCE 2 — MINER TREASURY LIQUIDATION (temporary, fading)
Public miners sold 32,000 BTC in Q1 2026 — more than all of 2025 — due to post-halving margin compression. That is approximately 355 BTC/day from public miners alone. Accounting for private miners (roughly 50% of hash rate), total miner selling runs approximately 710 BTC/day currently.
Sources: Blockonomi, CoinTelegraph, CryptoSlate, CoinShares Q1 2026 Report
This is a stress-peak figure. Multiple sources note this selling is approaching exhaustion as the least efficient miners shut down or pivot to AI compute. Miner treasury reserves have declined from approximately 1.86M BTC in 2023 to approximately 1.8M BTC in Q2 2026. The treasury is finite and being drawn down.
SOURCE 3 — LONG-TERM HOLDER PROFIT-TAKING (residual, small)
Long-term holders (LTH) currently control approximately 75% of circulating supply, roughly 14.8M BTC. Historical LTH sell rates in non-peak periods run 0.1 to 0.3% of holdings per year — approximately 40 to 120 BTC/day. Using 100 BTC/day as a conservative steady-state estimate.
TOTAL STRUCTURAL SELL SIDE:
Current 2026:
New mining issuance: 450 BTC/day
Miner treasury (elevated): 710 BTC/day
LTH profit-taking: 100 BTC/day
TOTAL: 1,260 BTC/day
Projected 2027 (miner selling fades):
New mining issuance: 450 BTC/day
Miner treasury (fading): 200 BTC/day
LTH profit-taking: 100 BTC/day
TOTAL: 750 BTC/day
Post-2028 halving:
New mining issuance: 225 BTC/day
Miner treasury (minimal): 50 BTC/day
LTH profit-taking: 100 BTC/day
TOTAL: 375 BTC/day
The sell side is permanently and deterministically declining. This is not an opinion. It is a protocol schedule.
───────────────────────────────────────────
PART 2: THREE DEMAND ERAS — DERIVED FROM OBSERVED EXCHANGE DEPLETION
Key methodological principle: exchange reserve depletion rate equals total demand minus total supply reaching exchanges. This means the net demand differential can be derived directly from on-chain observable data without estimating anything. The observed depletion rate is the net demand differential.
Exchange reserves peaked at approximately 3.2M BTC in 2023. They currently sit at approximately 2.25M BTC — an 18-year low.
Sources: SpotedCrypto, ValueTheMarkets
───────────────────────────────────────────
ERA 0 — PRE-INSTITUTIONAL BASELINE (before August 2020)
Observation: Exchange reserves stable at 3.1 to 3.2M BTC for approximately two years. No persistent depletion trend.
Derived net demand differential: approximately 0 BTC/day (near equilibrium)
Gross demand approximately equaled gross supply. Mining issuance of 1,800 BTC/day was absorbed by organic retail demand at roughly the same rate. The market was balanced between traders, early adopters, and sellers.
Sources: Finbold, AMBCrypto
───────────────────────────────────────────
ERA 1 — EARLY INSTITUTIONAL PHASE (August 2020 to January 2024)
Observed data:
Start reserves: approximately 3.1M BTC (Aug 2020)
End reserves: approximately 2.5M BTC (Jan 2024)
Delta: 600,000 BTC depleted
Time: 1,245 days
Calculation (reproducible):
Net drain rate = 600,000 divided by 1,245 days = 481 BTC/day
Gross demand = 481 (net drain) + 900 (mining supply) = 1,381 BTC/day
DERIVED NET DEMAND DIFFERENTIAL: 481 BTC/day
This era was not primarily a demand explosion. It was the May 2020 halving cutting supply from 1,800 to 900 BTC/day that created a structural deficit against relatively stable gross demand, amplified by systematic corporate treasury accumulation — MicroStrategy, Tesla, Square, and a growing class of corporate buyers. The supply halved. Demand held. The deficit began.
───────────────────────────────────────────
ERA 2 — TIER 1 FULL INSTITUTIONAL (January 2024 to Present)
Observed data:
Peak reserves (2023): approximately 3.2M BTC
Current reserves (Apr 2026): approximately 2.25M BTC
Delta: 950,000 BTC depleted
Time: approximately 1,095 days
Calculation (reproducible):
Net drain rate = 950,000 divided by 1,095 days = 868 BTC/day
ETF verification:
All U.S. spot Bitcoin ETFs combined have averaged 900 to 950 BTC/day absorbed through 2024 and into 2026. On April 26, 2026: 932.7 BTC net inflow recorded in a single day.
Sources: Newhedge (daily ETF flow tracker), Gate.io Bitcoin ETF tracker
BlackRock IBIT alone holds approximately 802,000 BTC accumulated over approximately 820 days, which equals roughly 978 BTC/day absorbed. IBIT alone is absorbing more than double the total daily new mining supply of 450 BTC/day.
DERIVED NET DEMAND DIFFERENTIAL: 868 BTC/day
This number is not an estimate. It is the measured rate of exchange reserve depletion. It is what is happening right now, in real time, without any further regulatory unlock. No CLARITY Act. No pension funds. No 401k plans. No insurance reserves. Just ETFs, corporate treasuries, and wealth management.
───────────────────────────────────────────
PART 3: THE STRUCTURAL DEMAND FLOOR
Not all demand is discretionary. Some is structurally committed and cannot be withdrawn without the accumulating entities violating their own stated investment mandates.
Structural floor components:
ETF mechanical inflows (minimum): 300 BTC/day
Strategy systematic DCA: 150 BTC/day
Other corporate treasury (160+ firms): 100 BTC/day
Organic retail HODLer base: 100 BTC/day
International institutional (EU, Asia): 100 BTC/day
TOTAL GROSS FLOOR: 750 BTC/day
Net structural floor calculation:
Gross demand floor: 750 BTC/day
New issuance floor: 450 BTC/day
NET FLOOR: 300 BTC/day
This 300 BTC/day floor cannot reach zero while the current institutional paradigm exists. It requires Strategy to liquidate its entire position, all ETFs to simultaneously see persistent outflows, and all international institutional activity to stop. The data shows no indication of any of these conditions.
NATURAL ERA 2 ACCELERATION COMING — WITHOUT ANY NEW DEMAND:
As miner treasury selling fades from approximately 710 BTC/day toward approximately 200 BTC/day through 2027, the net drain rate increases by approximately 510 BTC/day with zero change in demand. ERA 2 naturally accelerates from 868 BTC/day toward approximately 1,250 BTC/day net drain purely as a function of the miner stress cycle resolving.
───────────────────────────────────────────
PART 4: WHAT IS CURRENTLY LOCKED OUT OF THE MARKET
This is the variable most public analysis is missing.
WHAT HAS PASSED:
The GENIUS Act (stablecoin regulation) was signed into law July 18, 2025 — Public Law 119-27. Source: Congress.gov. This legitimizes the payment stablecoin ecosystem and the rails adjacent to Bitcoin but does not directly unlock institutional Bitcoin demand.
WHAT HAS NOT PASSED:
The Digital Asset Market Clarity Act (CLARITY Act) — which provides the regulatory safe harbor required for U.S. pension funds, 401k plans, insurance reserves, and bank custody products to formally allocate to Bitcoin.
Current status as of April 27, 2026: stalled in the Senate. Primary blocker is a dispute over whether stablecoins can pay yield to holders — a fight between banks and the crypto industry that has nothing to do with Bitcoin's classification. Bitcoin's commodity classification under the bill is not in dispute.
Critical deadline: Senator Moreno's end-of-May ultimatum. If no Senate floor vote by the Memorial Day recess (May 21, 2026), the bill is likely shelved until at least 2030 per multiple legislative analysts. Prediction market odds of 2026 passage: 50 to 72%.
Sources: GreyJournal, Disruption Banking (April 23, 2026), Galaxy Research
THE RESTRICTED CAPITAL POOL:
U.S. pension funds: approximately $40 trillion AUM (ICI 2025)
401k market: approximately $10 trillion AUM (ICI 2025)
Insurance reserves: approximately $8 trillion AUM (NAIC 2025)
University endowments: approximately $800 billion AUM (NACUBO 2025)
U.S.-aligned sovereign wealth: approximately $2 trillion AUM (various)
TOTAL RESTRICTED POOL: approximately $60.8 trillion
Key data point: Coinbase and Parthenon survey, March 2026 — 65% of institutional investors cite regulatory clarity as the primary trigger for increasing crypto allocations.
This demand is not hypothetical. It is explicitly waiting behind a specific regulatory gate.
The ERA 2 accumulation happening right now — 868 BTC/day net drain — is occurring entirely without this capital pool participating.
───────────────────────────────────────────
PART 5: ERA 3 DEMAND DIFFERENTIAL — THREE SCENARIOS
Formula (reproducible):
T2 Daily BTC = (AUM times Allocation%) divided by (Pipeline Years times 365 times BTC Price)
ERA3 Net Drain = ERA2 Net Drain + T2 Daily BTC addition
Allocation scenarios are consistent with gold ETF adoption precedent of 1 to 3% allocation in the first 5 years following institutional unlock:
CONSERVATIVE SCENARIO (1% of AUM, 5-year pipeline):
Dollar allocation: $608 billion
Daily BTC demand added at $77,000: 4,327 BTC/day
ERA3 total net drain: approximately 4,817 BTC/day
Multiplier vs ERA2: 5.5 times
MODERATE SCENARIO (2% of AUM, 3-year pipeline):
Dollar allocation: $1.216 trillion
Daily BTC demand added at $77,000: 14,422 BTC/day
ERA3 total net drain: approximately 14,930 BTC/day
Multiplier vs ERA2: 17.2 times
AGGRESSIVE SCENARIO (5% of AUM, 2-year pipeline):
Dollar allocation: $3.04 trillion
Daily BTC demand added at $77,000: 54,083 BTC/day
ERA3 total net drain: approximately 54,591 BTC/day
Multiplier vs ERA2: 62.9 times
Note on price: As price rises, the same dollar allocation acquires fewer BTC. These figures represent the demand volume that attempts to enter at current prices. The market price-rations the demand upward. This is precisely the mechanism by which price must rise to create balance — not speculation, but arithmetic.
───────────────────────────────────────────
PART 6: EXCHANGE DEPLETION TIMELINE
Formula (reproducible):
Days to threshold = (Exchange Reserve minus Threshold) divided by Net Daily Drain
Starting point: 2,250,000 BTC on exchanges. April 27, 2026.
Critical thresholds:
1,500,000 BTC — price action amplifies significantly
1,000,000 BTC — severe liquidity constraint
500,000 BTC — structural impossibility at current prices
TIME TO 1,500,000 BTC THRESHOLD:
Structural floor (300/day): 833 days → March 2029
ERA 2 current (868/day): 288 days → January 2027
ERA 2 accelerated (1,250/day): 200 days → November 2026
ERA 3 Conservative (4,817/day): 156 days → October 2026
ERA 3 Moderate (14,930/day): 50 days → June 2026
ERA 3 Aggressive (54,591/day): 14 days → May 2026
TIME TO 1,000,000 BTC THRESHOLD:
Structural floor (300/day): 4,167 days → January 2038
ERA 2 current (868/day): 865 days → September 2028
ERA 2 accelerated (1,250/day): 600 days → December 2027
ERA 3 Conservative (4,817/day): 260 days → January 2027
ERA 3 Moderate (14,930/day): 84 days → July 2026
ERA 3 Aggressive (54,591/day): 23 days → May 2026
IMPORTANT INTERPRETATION NOTE:
These timelines do not represent when exchanges literally empty. They represent when the market becomes structurally forced to price-discover upward — when a single large institutional purchase cannot be filled by available exchange liquidity without significant price impact. The response begins before the threshold, not at it.
At 1.5M BTC on exchanges, a $1 billion institutional purchase at $77,000 equals approximately 13,000 BTC, which is 0.87% of remaining exchange supply versus 0.58% today. Price sensitivity to large purchases scales inversely with available liquidity. The supply shock accelerates as the denominator shrinks.
───────────────────────────────────────────
PART 7: THE STRUCTURAL EQUILIBRIUM BRACKET
At some price level, demand is rationed and existing holder supply is unlocked — a new equilibrium forms. This price is calculable within a bracket.
LTH supply potentially unlockable at each price level (estimated from cost basis distribution):
At $100,000: approximately 60% of 14.8M LTH supply willing to sell = 8.9M BTC
Total available (exchange plus LTH): approximately 11.1M BTC
At $150,000: approximately 75% of 14.8M LTH supply willing to sell = 11.1M BTC
Total available: approximately 13.4M BTC
At $200,000: approximately 85% of 14.8M LTH supply willing to sell = 12.6M BTC
Total available: approximately 14.8M BTC
Demand vs. unlockable supply by scenario:
CONSERVATIVE ($608B total T2 demand):
BTC demanded at $100,000: 6.1M BTC
BTC available at $100,000: 11.1M BTC
Balance achievable at approximately $100,000
Equilibrium bracket: $100,000 to $130,000
MODERATE ($1.216T total T2 demand):
BTC demanded at $150,000: 8.1M BTC
BTC available at $150,000: 13.4M BTC
Balance achievable at approximately $150,000
Equilibrium bracket: $140,000 to $180,000
AGGRESSIVE ($3.04T total T2 demand):
BTC demanded at $250,000: 12.2M BTC
BTC available at $250,000: approximately 16M BTC
Balance achievable at approximately $250,000
Equilibrium bracket: $200,000 to $300,000 and above
CROSS-CHECK AGAINST MAJOR INSTITUTIONAL FORECASTS:
Standard Chartered: $100,000 to $200,000 → Conservative to Moderate
JP Morgan: approximately $170,000 → Moderate
Bernstein: $150,000 to $200,000 → Moderate to Aggressive
Citi / Goldman / Fundstrat: $200,000 to $250,000 → Aggressive
These institutions are not publishing price targets arbitrarily. They are running demand models against supply constraints. The brackets produced by independent first-principles derivation converge with their published targets.
Current price of approximately $77,000 sits below the conservative structural equilibrium bracket of $100,000 to $130,000. This means at any level of Tier 2 activation, current price is structurally below the point where supply and demand can balance.
───────────────────────────────────────────
PART 8: THE STALL AS A COMPRESSION EVENT
The CLARITY Act stall is commonly framed as a negative. Structurally, it is not.
The stall does not prevent ERA 2 demand (868 BTC/day) from continuing. Exchange reserves are at 18-year lows despite the stall. The stall only prevents the Tier 2 capital pool from participating.
What the stall is doing:
— ERA 2 accumulation continues depleting exchange supply at 868 BTC/day
— Tier 2 demand accumulates behind the regulatory gate
— Every month of stall depletes approximately 26,000 more BTC from exchanges
— The supply environment that Tier 2 enters upon unlock becomes progressively more constrained
The longer the stall, the more depleted the supply that Tier 2 encounters upon entry.
The delay amplifies the magnitude of the eventual structural event. It does not prevent it.
Scenario comparison:
CLARITY passes May 2026 (R1):
Tier 2 enters against approximately 2.1 to 2.2M BTC exchange supply
Conservative equilibrium: $100,000 to $130,000 range
CLARITY passes 2027 (R2):
ERA 2 depletion continues at 868 to 1,250 BTC/day for 12 more months
Tier 2 enters against approximately 1.0 to 1.5M BTC exchange supply
Moderate equilibrium: $150,000 to $300,000 range
The delay produced a larger structural event on a longer timeline.
───────────────────────────────────────────
THE FOUR NUMBERS
From this entire derivation, four numbers emerge that require no opinion:
NUMBER 1 — THE STRUCTURAL FLOOR NET DRAIN: 300 BTC/day
The minimum net drain under maximum demand pessimism. Direction is fixed in all scenarios. The exchange reserve can only go one direction from here.
NUMBER 2 — THE ERA 2 OBSERVED NET DRAIN: 868 BTC/day
Not estimated. The measured rate of exchange reserve depletion over 1,095 days. This will naturally accelerate toward approximately 1,250 BTC/day as miner treasury selling exhausts — with zero new demand required.
NUMBER 3 — THE CLARITY ACT DEMAND MULTIPLIER: 5.5 to 62.9 times ERA 2
Even the conservative Tier 2 scenario (1% of $60.8 trillion over 5 years) produces 5.5 times the current observed net drain rate.
NUMBER 4 — THE STRUCTURAL EQUILIBRIUM BRACKET: $100,000 to $300,000 and above
The price range at which Tier 2 demand can be rationed against unlockable LTH supply. Current price of approximately $77,000 is below the floor of the conservative bracket in every Tier 2 scenario.
───────────────────────────────────────────
FALSIFICATION CONDITIONS
This model is wrong if any of the following occur:
— Exchange reserves stabilize or increase persistently despite confirmed ongoing institutional accumulation
— ERA 2 net drain drops below the structural floor of 300 BTC/day while institutional mandates remain in place
— Strategy or BlackRock IBIT begin net distribution of their positions at scale
— The CLARITY Act fails permanently AND EU MiCA and Asian regulatory frameworks also fail to unlock equivalent Tier 2 capital globally
— A competing protocol captures the majority of institutional allocation demand at the expense of Bitcoin
— The Bitcoin mining protocol changes its issuance schedule (cryptographically and socially not possible)
If these conditions are not met, the structural direction holds. Timing and magnitude remain variables. Direction does not.
───────────────────────────────────────────
WHAT THIS IS NOT
This is not a call to buy Bitcoin.
This is not a price prediction.
This is not investment advice.
I hold Bitcoin. That is a conflict of interest you should know about.
This is a demand differential model showing, from sourced and auditable public data, that the gap between structural sell-side supply and institutional-era buy-side demand has been persistently and measurably positive since 2020, that it is widening, and that a significant additional demand pool is waiting behind a regulatory gate with a calculable and near-term opening window.
Substitute your own inputs. The formulas are shown.
───────────────────────────────────────────
KEY SOURCES
Exchange reserve data: SpotedCrypto, ValueTheMarkets, Finbold, AMBCrypto, Grokipedia
ETF flows: Newhedge, Gate.io Bitcoin ETF tracker, WalletPilot
Miner selling: Blockonomi, CoinTelegraph, CryptoSlate, CoinShares Q1 2026
Regulatory status: Congress.gov (GENIUS Act), GreyJournal, Disruption Banking, Galaxy Research
Restricted capital AUM: ICI 2025, NAIC 2025, NACUBO 2025
Institutional forecasts: Standard Chartered, JP Morgan, Bernstein, Citi, Goldman, Fundstrat
All formulas reproducible. All inputs cited. All falsification conditions named.
トレード稼働中
Made mistake stating that this is 18 year low, that was honest mistake since of course exchanges and bitcoin have not existed for 18 years, I am stating this is all time low for entire existence of exchanges that trade bitcoin. Is more like 15-16 years lowest. Additionally there was previous mention by MasterAnanda that there was a mistake with a reference of 900 bitcoin being supplied by miners. After looking over the idea I see I made mention of 900 mining supply many times between ERA 0 and ERA 1, between the time period for which mining suppliers mined 900. This should correspond to the 2020-2024 halving period where 900 bitcoin supply which appears to be correct. If there are any mistakes to be corrected, please inform me! The analysis as it stands remains unchanged at this point. I appreciate any corrections as this article is meant to be informative, not a statement of my predictive power.To state this clearly, this is not a bear or bull case. I personally interpret the data as a bull case, but I did not create or construct this. I am reading data, the data points to a direction, I read the causality of the geometry of the data. These are not inferences, opinions, or predictions. These are stated structural causal factors that are built upon the protocol level constraints that bitcoin has inherently, as well as obligations that can be depended on for consistent floor of demand. The only speculation is policy based as well as aggressive nature of adoption once the regulations become more clear. I put this into a range of adoption, this matches precisely with predictions made by institutions accumulating.
All calculations should be auditable, reproducible, and understandable from publicly observable data. I hope this helps everyone who reads this idea, the nature of the changing landscape that bitcoin resides in.

免責事項
これらの情報および投稿は、TradingViewが提供または承認する金融、投資、取引、またはその他の種類の助言もしくは推奨であることを意図したものではなく、またこれらに該当するものでもありません。詳細は利用規約をご覧ください。
免責事項
これらの情報および投稿は、TradingViewが提供または承認する金融、投資、取引、またはその他の種類の助言もしくは推奨であることを意図したものではなく、またこれらに該当するものでもありません。詳細は利用規約をご覧ください。