
credits to dd for the timeframe idea.
Experimental chart, testing timeframe.-
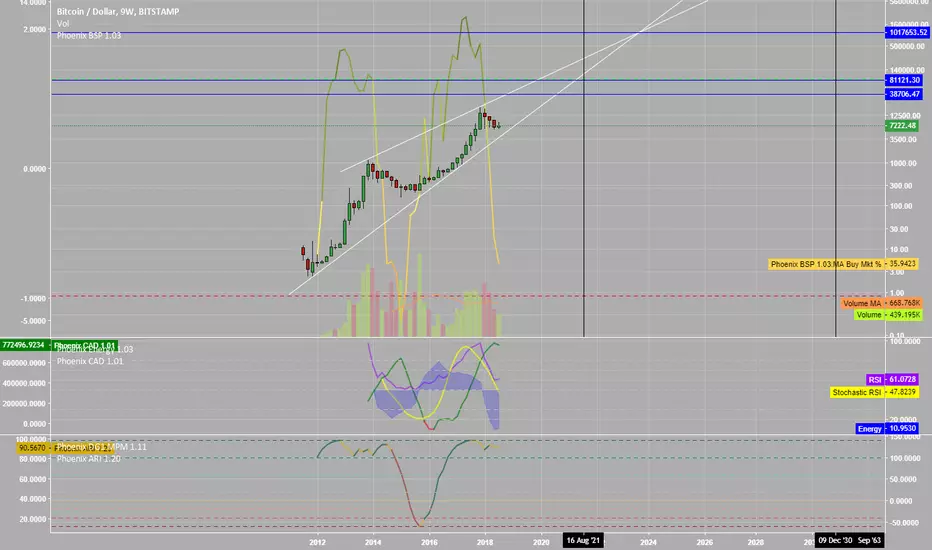
As you can see the blue area (energy) has bottomed and is already going up. Green line is accumulation and its peaked (check 2015's bottom)
the only thing that maybe still needs to bottom is the indicator behind the candles (bsp) but it can turn and bottom right here.
targets are based on previous trends slopes.
Experimental chart, testing timeframe.-
As you can see the blue area (energy) has bottomed and is already going up. Green line is accumulation and its peaked (check 2015's bottom)
the only thing that maybe still needs to bottom is the indicator behind the candles (bsp) but it can turn and bottom right here.
targets are based on previous trends slopes.

免責事項
これらの情報および投稿は、TradingViewが提供または承認する金融、投資、取引、またはその他の種類の助言もしくは推奨であることを意図したものではなく、またこれらに該当するものでもありません。詳細は利用規約をご覧ください。
免責事項
これらの情報および投稿は、TradingViewが提供または承認する金融、投資、取引、またはその他の種類の助言もしくは推奨であることを意図したものではなく、またこれらに該当するものでもありません。詳細は利用規約をご覧ください。