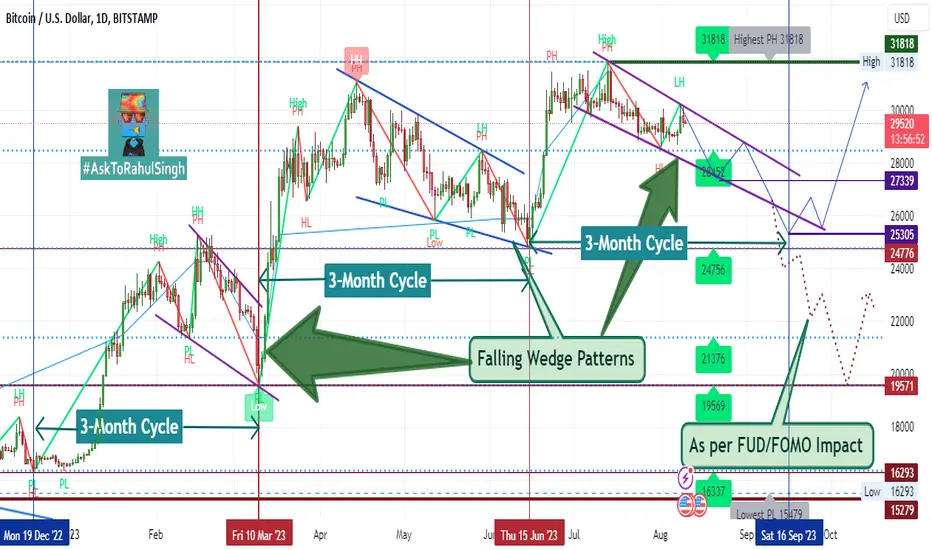
BITCOIN 1-day Chart on #BitStamp
This chart pattern show out the movements of 3-month cycle as per daily analysis from dec-2022 to Nov. 2023 of 1-year market trends. Into every 3-month cycle, BTC downtrend divergence by Falling Wedge Pattern.
Market need a big correction, ad first Lower-Low divergence will be 27K-$FWB:25K, and if market goes into hard FUD/FOMO impact, then its Last Lower-Low cut-off point is around here.... $21.5k to $19.5k.
Always #DYOR, Trade with #StopLoss, It's #NFA
&
Must LIKE, SHARE % Comments
This chart pattern show out the movements of 3-month cycle as per daily analysis from dec-2022 to Nov. 2023 of 1-year market trends. Into every 3-month cycle,
BTC downtrend divergence by Falling Wedge Pattern. Market need a big correction, ad first Lower-Low divergence will be
27K-$FWB:25K, and if market goes into hard FUD/FOMO impact, then its Last Lower-Low cut-off point is around here.... $21.5k to $19.5k.Always #DYOR, Trade with #StopLoss, It's #NFA
&
Must LIKE, SHARE % Comments

関連の投稿
免責事項
これらの情報および投稿は、TradingViewが提供または承認する金融、投資、取引、またはその他の種類の助言もしくは推奨であることを意図したものではなく、またこれらに該当するものでもありません。詳細は利用規約をご覧ください。
関連の投稿
免責事項
これらの情報および投稿は、TradingViewが提供または承認する金融、投資、取引、またはその他の種類の助言もしくは推奨であることを意図したものではなく、またこれらに該当するものでもありません。詳細は利用規約をご覧ください。