
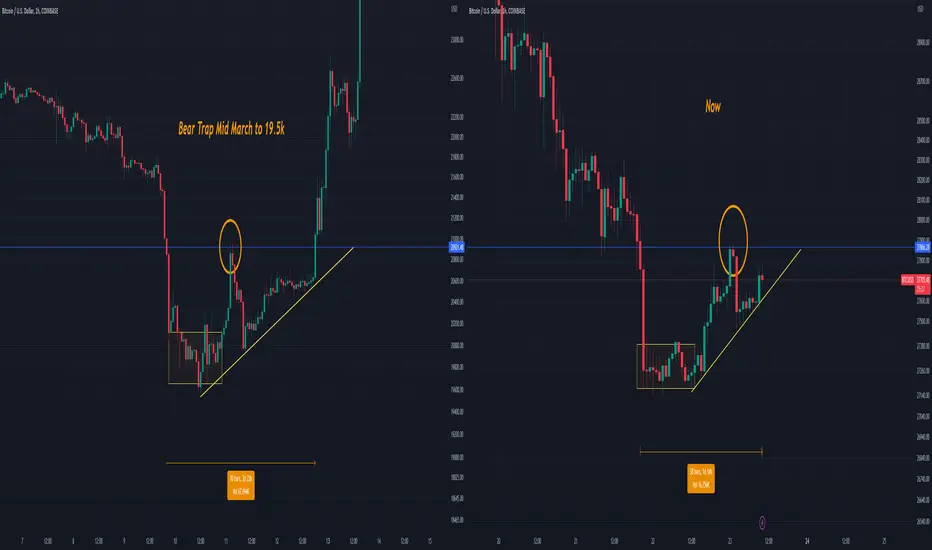
Interesting fractal appearing here on the 1hour , this is the same fractal that appeared when Bitcoin made that massive bear trap down to 19.5k.
This fractal appears in all timeframes and it is a bottoming fractal most of the time.
The higher the timeframe the bigger the move , this was the fractal that formed at 15-18k range.

Closing above the blue line within this pattern would be key here to long ,risky one no doubt.
This fractal appears in all timeframes and it is a bottoming fractal most of the time.
The higher the timeframe the bigger the move , this was the fractal that formed at 15-18k range.
Closing above the blue line within this pattern would be key here to long ,risky one no doubt.

免責事項
これらの情報および投稿は、TradingViewが提供または承認する金融、投資、取引、またはその他の種類の助言もしくは推奨であることを意図したものではなく、またこれらに該当するものでもありません。詳細は利用規約をご覧ください。
免責事項
これらの情報および投稿は、TradingViewが提供または承認する金融、投資、取引、またはその他の種類の助言もしくは推奨であることを意図したものではなく、またこれらに該当するものでもありません。詳細は利用規約をご覧ください。