
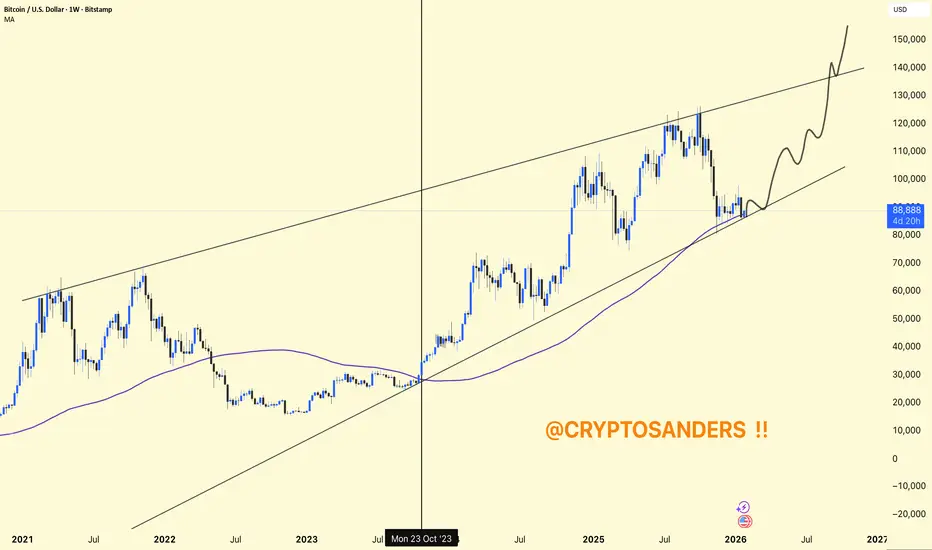
BTCUSDT (Weekly) – Long-term Chart Update.
BTC is still inside a rising channel (higher highs & higher lows intact).
Price is holding the lower trendline support of the channel — a key bullish area.
The weekly MA (~87.5k) is acting as dynamic support.
Current price: ~88.7k
This is a make-or-break support region.
As long as weekly closes stay above the lower channel + MA, the bullish structure remains valid.
Consolidation above 85k–90k.
100k psychological-
120k–125k (channel mid/upper area)
Extended cycle target 140k–150k+ (as projected)
Weekly close below ~85k.
Break of channel support → deeper correction toward 75k–70k.
short-term consolidation
Buy the dip mindset while structure holds.
BTC is still inside a rising channel (higher highs & higher lows intact).
Price is holding the lower trendline support of the channel — a key bullish area.
The weekly MA (~87.5k) is acting as dynamic support.
Current price: ~88.7k
This is a make-or-break support region.
As long as weekly closes stay above the lower channel + MA, the bullish structure remains valid.
Consolidation above 85k–90k.
100k psychological-
120k–125k (channel mid/upper area)
Extended cycle target 140k–150k+ (as projected)
Weekly close below ~85k.
Break of channel support → deeper correction toward 75k–70k.
short-term consolidation
Buy the dip mindset while structure holds.

関連の投稿
免責事項
これらの情報および投稿は、TradingViewが提供または承認する金融、投資、取引、またはその他の種類の助言もしくは推奨であることを意図したものではなく、またこれらに該当するものでもありません。詳細は利用規約をご覧ください。
関連の投稿
免責事項
これらの情報および投稿は、TradingViewが提供または承認する金融、投資、取引、またはその他の種類の助言もしくは推奨であることを意図したものではなく、またこれらに該当するものでもありません。詳細は利用規約をご覧ください。