
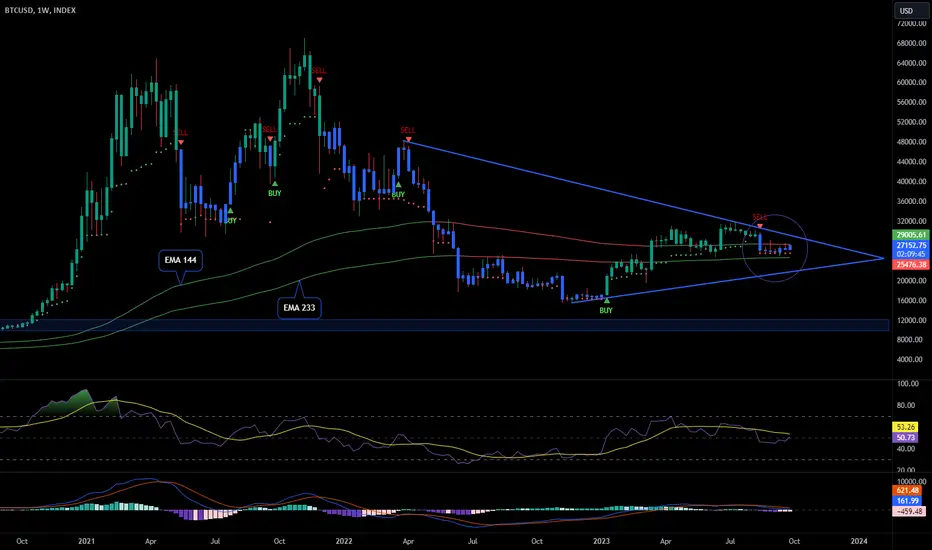
- Sell Signal Below Resistance Trend Line
- Squeeze between EMA 144 and 233
- RSI Picking Up
- MACD Neutral/Descending
Looking back to 2020 we can see a similar pattern.
What this mean?!?....
Well, it can repeat the same pattern that seems more sensible to me or in case of breaking the EMA 233 we will see a continuation of the downtrend towards the $10,000 region.
It was like this throughout September, squeeze between the two EMAs.
We will definitely have a lot of volatility this month and perhaps until the end of the year.
- Squeeze between EMA 144 and 233
- RSI Picking Up
- MACD Neutral/Descending
Looking back to 2020 we can see a similar pattern.
What this mean?!?....
Well, it can repeat the same pattern that seems more sensible to me or in case of breaking the EMA 233 we will see a continuation of the downtrend towards the $10,000 region.
It was like this throughout September, squeeze between the two EMAs.
We will definitely have a lot of volatility this month and perhaps until the end of the year.

免責事項
これらの情報および投稿は、TradingViewが提供または承認する金融、投資、取引、またはその他の種類の助言もしくは推奨であることを意図したものではなく、またこれらに該当するものでもありません。詳細は利用規約をご覧ください。
免責事項
これらの情報および投稿は、TradingViewが提供または承認する金融、投資、取引、またはその他の種類の助言もしくは推奨であることを意図したものではなく、またこれらに該当するものでもありません。詳細は利用規約をご覧ください。