
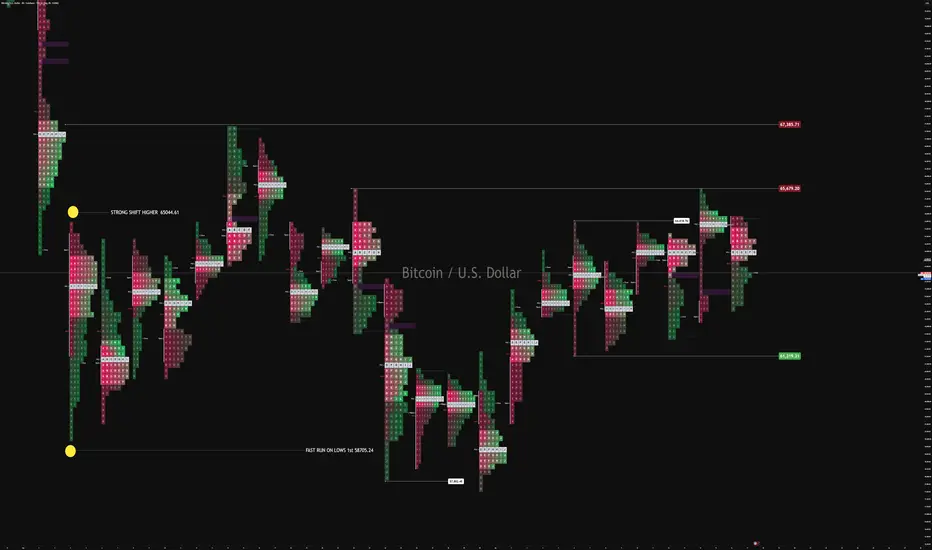
Bitcoin has spent nearly two months consolidating after its bullish expansion. Price continues to trade within a defined range, with buyers absorbing selling pressure while liquidity builds on both sides of the market.
The most important structural development is the daily bullish shift established at 65,044. Before that shift, Bitcoin swept downside liquidity twice, removing resting sell-side stops before rotating higher.
The primary levels on my chart are:
61,219 — downside liquidity
65,679 — first upside liquidity
67,385 — higher upside liquidity
I am not interested in predicting which level will be reached first.
Instead, I want to see one side of the range liquidated, followed by a decisive rejection back into the range and a clear shift in market structure. If that sequence develops, the opposite side of the range becomes the next logical liquidity objective.
This remains one of Bitcoin's most consistent liquidity behaviors.
Despite the recent decline, Bitcoin remains in a broader monthly consolidation. Another downside liquidity sweep is still possible before the market expands higher.
Previous consolidations displayed similar behavior. Daily and weekly structures shifted repeatedly while the monthly structure remained unchanged.
For that reason, daily breaks alone should not be treated as trend confirmation. In Bitcoin, they often represent liquidity events before the larger move begins.
I am waiting for one side of the range to be cleared. If price quickly rejects back into the range and confirms a structural shift, I will expect the market to rotate toward the opposing liquidity pool.
Until then, patience remains the highest-probability position.
I'll keep you posted.
The most important structural development is the daily bullish shift established at 65,044. Before that shift, Bitcoin swept downside liquidity twice, removing resting sell-side stops before rotating higher.
The primary levels on my chart are:
61,219 — downside liquidity
65,679 — first upside liquidity
67,385 — higher upside liquidity
I am not interested in predicting which level will be reached first.
Instead, I want to see one side of the range liquidated, followed by a decisive rejection back into the range and a clear shift in market structure. If that sequence develops, the opposite side of the range becomes the next logical liquidity objective.
This remains one of Bitcoin's most consistent liquidity behaviors.
Despite the recent decline, Bitcoin remains in a broader monthly consolidation. Another downside liquidity sweep is still possible before the market expands higher.
Previous consolidations displayed similar behavior. Daily and weekly structures shifted repeatedly while the monthly structure remained unchanged.
For that reason, daily breaks alone should not be treated as trend confirmation. In Bitcoin, they often represent liquidity events before the larger move begins.
I am waiting for one side of the range to be cleared. If price quickly rejects back into the range and confirms a structural shift, I will expect the market to rotate toward the opposing liquidity pool.
Until then, patience remains the highest-probability position.
I'll keep you posted.

Danel Fadejev
Founder, CORE 5 Tradecraft
Measure. Define. Qualify. Authorize. Execute. Protect. Record. Audit. Scale. Repeat.
— CORE5DAN
Institutional Logic. Modern Technology. Real Freedom.
Founder, CORE 5 Tradecraft
Measure. Define. Qualify. Authorize. Execute. Protect. Record. Audit. Scale. Repeat.
— CORE5DAN
Institutional Logic. Modern Technology. Real Freedom.
関連の投稿
免責事項
これらの情報および投稿は、TradingViewが提供または承認する金融、投資、取引、またはその他の種類の助言もしくは推奨であることを意図したものではなく、またこれらに該当するものでもありません。詳細は利用規約をご覧ください。
Danel Fadejev
Founder, CORE 5 Tradecraft
Measure. Define. Qualify. Authorize. Execute. Protect. Record. Audit. Scale. Repeat.
— CORE5DAN
Institutional Logic. Modern Technology. Real Freedom.
Founder, CORE 5 Tradecraft
Measure. Define. Qualify. Authorize. Execute. Protect. Record. Audit. Scale. Repeat.
— CORE5DAN
Institutional Logic. Modern Technology. Real Freedom.
関連の投稿
免責事項
これらの情報および投稿は、TradingViewが提供または承認する金融、投資、取引、またはその他の種類の助言もしくは推奨であることを意図したものではなく、またこれらに該当するものでもありません。詳細は利用規約をご覧ください。