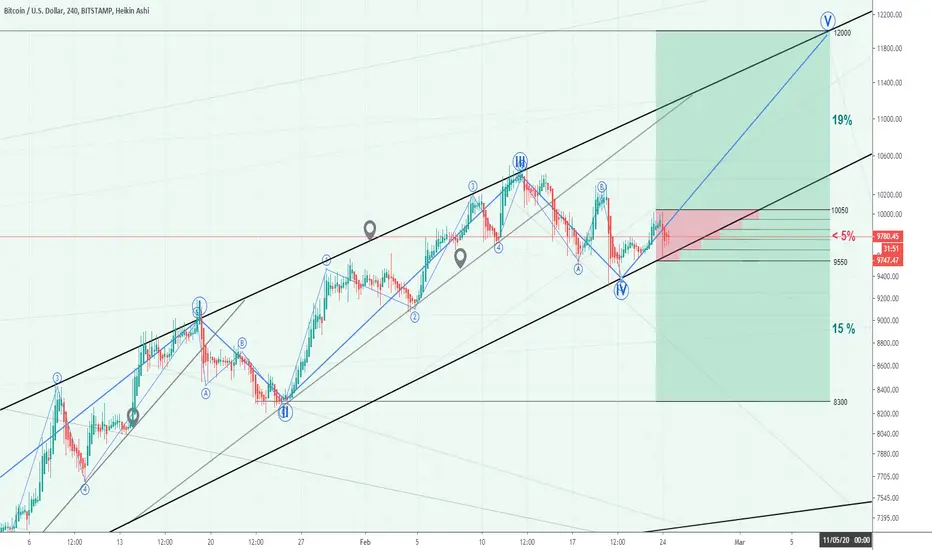
Short term:
The price is touching the rising channel support,
If it breaks one mid-term level down Target: 8300.
If it continues we'll rise one mid-term level up Target: 12000.
(i'm playing this on either side's breakout, using the opposite side as a stop-loss.)
Mid term:
We're in an uptrend before the halving, if the past is to repeat:
We will see a correction around the halving, bringing BTCUSD back near the long-term rising support.
Offering relatively low prices in a Long term perspective.
In the past the price sticks near the long-term rising support line:
This would be a good time to switch to a strategy that is LONG biased.
EG. mid term RSI with big longs and small shorts.
Long term:
From its Higher low to new highs, negatively correlating with the upcoming 2020-2021 Financial Debt Crash.
Going up to 50.000? 100.000? Who knows, it all depends on the values of BTC and USD
View on other timeframes : Bitcoin / U.S. Dollar (BITSTAMP:BTCUSD) (Temporary)
The price is touching the rising channel support,
If it breaks one mid-term level down Target: 8300.
If it continues we'll rise one mid-term level up Target: 12000.
(i'm playing this on either side's breakout, using the opposite side as a stop-loss.)
Mid term:
We're in an uptrend before the halving, if the past is to repeat:
We will see a correction around the halving, bringing
BTCUSD back near the long-term rising support.Offering relatively low prices in a Long term perspective.
In the past the price sticks near the long-term rising support line:
This would be a good time to switch to a strategy that is LONG biased.
EG. mid term RSI with big longs and small shorts.
Long term:
From its Higher low to new highs, negatively correlating with the upcoming 2020-2021 Financial Debt Crash.
Going up to 50.000? 100.000? Who knows, it all depends on the values of BTC and USD
View on other timeframes : Bitcoin / U.S. Dollar (BITSTAMP:BTCUSD) (Temporary)
ノート
Long term View:トレード稼働中
Short opened @ 9550 / Stop-loss @ 10050BTCUSD broke the rising channel, taking the short side.
Currently in a Narrowing descending wedge, and will likely form a broadening descending wedge.
On its way down it is likely to bounce between resistance levels.
トレード稼働中
Took some profit near the lower line of the broadening descending wedge.This will bounce of that line.
Going to re-short @ 9000 , Target still @ 8300
トレード終了: 利益確定目標に到達
𝗧𝗮𝗿𝗴𝗲𝘁𝘀 𝗥𝗲𝗮𝗰𝗵𝗲𝗱 (with some eyeballing)Will be posting a follow up 2mo

免責事項
これらの情報および投稿は、TradingViewが提供または承認する金融、投資、取引、またはその他の種類の助言もしくは推奨であることを意図したものではなく、またこれらに該当するものでもありません。詳細は利用規約をご覧ください。
免責事項
これらの情報および投稿は、TradingViewが提供または承認する金融、投資、取引、またはその他の種類の助言もしくは推奨であることを意図したものではなく、またこれらに該当するものでもありません。詳細は利用規約をご覧ください。