
Hello Traders,
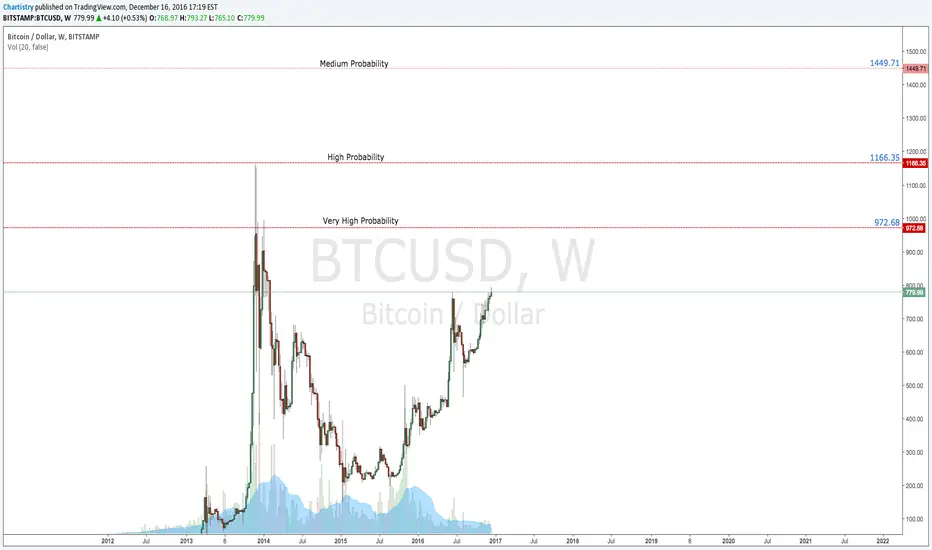
Putting Bitcoin to the test of the Forecasting model tells us that there is a high probability of a new all time highs being created in the near future.
For those that have not seen the model at work, take a look at the previous forecasts I have made in the related links below. It has proven to be quite a good tool to predict and forecast future price and reversal targets.
With that being said, Bitcoin does not escape the same dynamics that govern all financial markets, and thus, can be successfully predicted using the model I have used for the charts below.
The targets are defined as follows:
Dark Red = Very High Probability of attainment = Low Probability Reversal
Medium Red = High Probability of attainment = Medium Probability Reversal
Light Red = Medium Probability of attainment = High Probability Reversal
Stay tuned for further updates.
Chartistry
Putting Bitcoin to the test of the Forecasting model tells us that there is a high probability of a new all time highs being created in the near future.
For those that have not seen the model at work, take a look at the previous forecasts I have made in the related links below. It has proven to be quite a good tool to predict and forecast future price and reversal targets.
With that being said, Bitcoin does not escape the same dynamics that govern all financial markets, and thus, can be successfully predicted using the model I have used for the charts below.
The targets are defined as follows:
Dark Red = Very High Probability of attainment = Low Probability Reversal
Medium Red = High Probability of attainment = Medium Probability Reversal
Light Red = Medium Probability of attainment = High Probability Reversal
Stay tuned for further updates.
Chartistry
ノート
UPDATE: Model has identified a hidden resistance level. However, this is not to say that the rally will stop short here. Rather, we will see a short moment of either a correction or consolidation at this level before price continues to move forward.I will update this pair as it moves along.
Best,
Chartistry
ノート
Update: 1st Target hit dead on.ノート
UPDATE: Bullish move NOT over yet. Prepare for one more leg up to hit 1166 as indicated on chart and beyond. All time highs still a very high possibility. More updates with charts to come in the next few days.Best,
Chartistry
ノート
UPDATE: The High Probability Target has been hit. Still no sign of reversal. Expect the Medium Probability Target to have a significance in future price action.For those of you who have been in the buy position, congratulations and get ready to take profit soon.
Best.
Chartistry
ノート
UPDATE: Can this be the end of the bull run? Forecasting model suggests so.
Chartistry
ノート
UPDATE: WEEKLY time frame supersedes geometry development in the DAILY time frame. The WEEKLY time frame is now eyeing 1449.71 and with enough strength, 1559. 1559 remains a low probability target defined by the predictive/forecasting model. In the case price DOES continue to rise above 1559 I would look at the MONTHLY time frame for future price development. Chartistry
ノート
1449.71 hit DEAD ON! 1599 still remains a probability.
ノート
Target Hit DEAD ON!
関連の投稿
免責事項
これらの情報および投稿は、TradingViewが提供または承認する金融、投資、取引、またはその他の種類の助言もしくは推奨であることを意図したものではなく、またこれらに該当するものでもありません。詳細は利用規約をご覧ください。
関連の投稿
免責事項
これらの情報および投稿は、TradingViewが提供または承認する金融、投資、取引、またはその他の種類の助言もしくは推奨であることを意図したものではなく、またこれらに該当するものでもありません。詳細は利用規約をご覧ください。