
Dear traders:
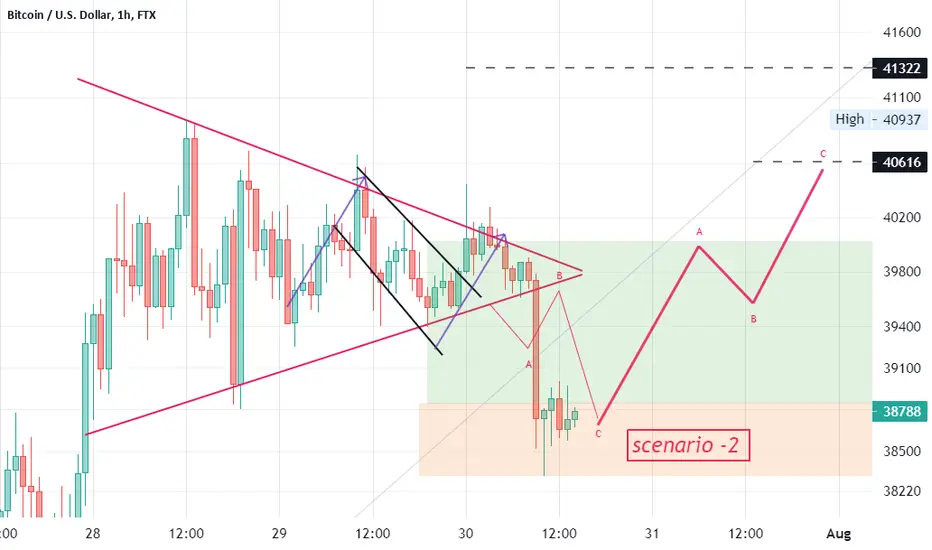
As you see, scenario 2 happened (see attached idea (Symmetrical Triangle)).
Based on the chart, 38333 $ touched. Jul 29 I told you: 38476 $ is (very) strong support (See attached Idea (Graphical idea (My Idea My way))).
Also, Based on DMI, We have a long way for market saturation!
Remember: we are inside a Mega bull flag pattern (Bull flag is the most bullish chart pattern (ever))
ノート
ノート
ノート
ノート
ノート
ノート
ノート
ノート
ノート
41600 $ touched,
関連の投稿
免責事項
これらの情報および投稿は、TradingViewが提供または承認する金融、投資、取引、またはその他の種類の助言もしくは推奨であることを意図したものではなく、またこれらに該当するものでもありません。詳細は利用規約をご覧ください。
免責事項
これらの情報および投稿は、TradingViewが提供または承認する金融、投資、取引、またはその他の種類の助言もしくは推奨であることを意図したものではなく、またこれらに該当するものでもありません。詳細は利用規約をご覧ください。