
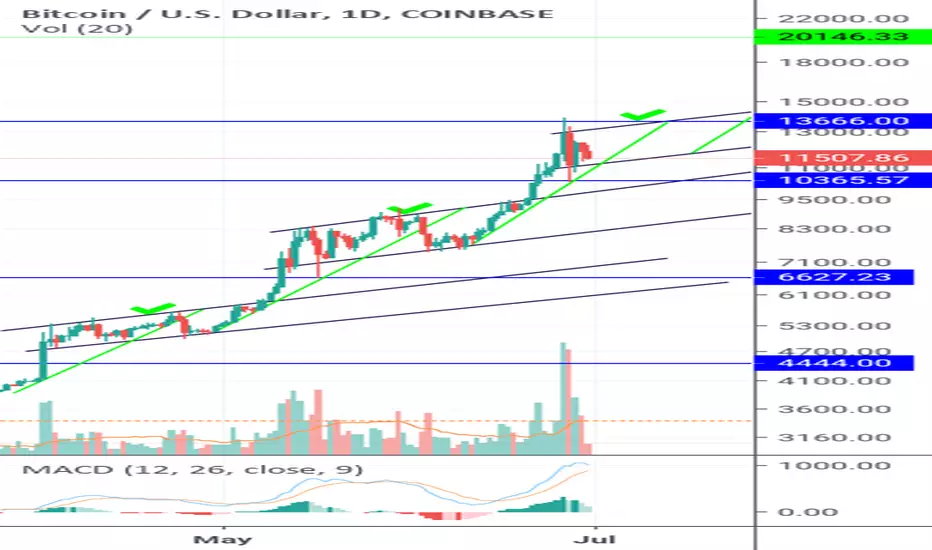
Redid my previous chart for better visuals. Im not a "moonboy" but price action does seem to be following this since capitulation. We're looking at target next of about 20k. 3 waves make a pattern so keep an eye on the bottom support of the current range between 13666 and 11200. 11k should hold and then the 21ema holds. Look at how the 21ema is following my regression line? Look at the previous ones. Now remember, those green regression lines were already plotted before the yellow 21ema then follows. At 20k, we'll see if it forms another wave for higher or what it does. Thanks for reading

関連の投稿
免責事項
これらの情報および投稿は、TradingViewが提供または承認する金融、投資、取引、またはその他の種類の助言もしくは推奨であることを意図したものではなく、またこれらに該当するものでもありません。詳細は利用規約をご覧ください。
免責事項
これらの情報および投稿は、TradingViewが提供または承認する金融、投資、取引、またはその他の種類の助言もしくは推奨であることを意図したものではなく、またこれらに該当するものでもありません。詳細は利用規約をご覧ください。