
Technical Analysis and Outlook:
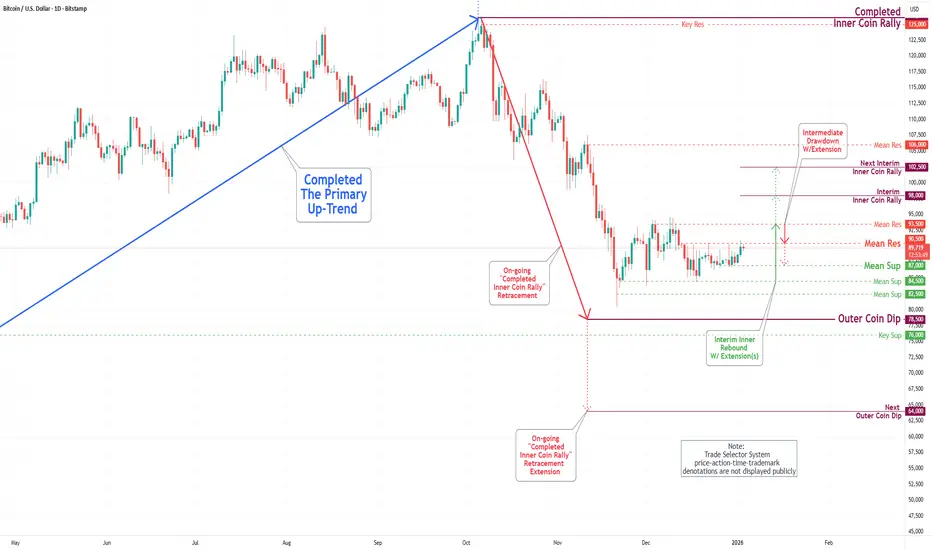
In this New Year's trading week, the Bitcoin market has climbed towards the upper end of our Active Inner Trading Zone (See Daily Chart Analysis For Week of Dec 26, 2025). This breakout from his progressive zone will be met by Mean Resistance at 93,500.
Given the prevailing dynamics in the cryptocurrency market, it is recommended that traders diligently monitor this price movement, as significant momentum is pushing prices toward the Interim Inner Coin Rally at 98,000 and the possibility of advancing to a subsequent Interim Coin Rally at 102,500.
On the downside, the principal target, identified for some time, is the Outer Coin Dip at 78,500, which might be realized once the Mean Resistance 93,500 is hit, along with the Interim Coin Rally at 102,500.
In this New Year's trading week, the Bitcoin market has climbed towards the upper end of our Active Inner Trading Zone (See Daily Chart Analysis For Week of Dec 26, 2025). This breakout from his progressive zone will be met by Mean Resistance at 93,500.
Given the prevailing dynamics in the cryptocurrency market, it is recommended that traders diligently monitor this price movement, as significant momentum is pushing prices toward the Interim Inner Coin Rally at 98,000 and the possibility of advancing to a subsequent Interim Coin Rally at 102,500.
On the downside, the principal target, identified for some time, is the Outer Coin Dip at 78,500, which might be realized once the Mean Resistance 93,500 is hit, along with the Interim Coin Rally at 102,500.

関連の投稿
免責事項
これらの情報および投稿は、TradingViewが提供または承認する金融、投資、取引、またはその他の種類の助言もしくは推奨であることを意図したものではなく、またこれらに該当するものでもありません。詳細は利用規約をご覧ください。
免責事項
これらの情報および投稿は、TradingViewが提供または承認する金融、投資、取引、またはその他の種類の助言もしくは推奨であることを意図したものではなく、またこれらに該当するものでもありません。詳細は利用規約をご覧ください。