
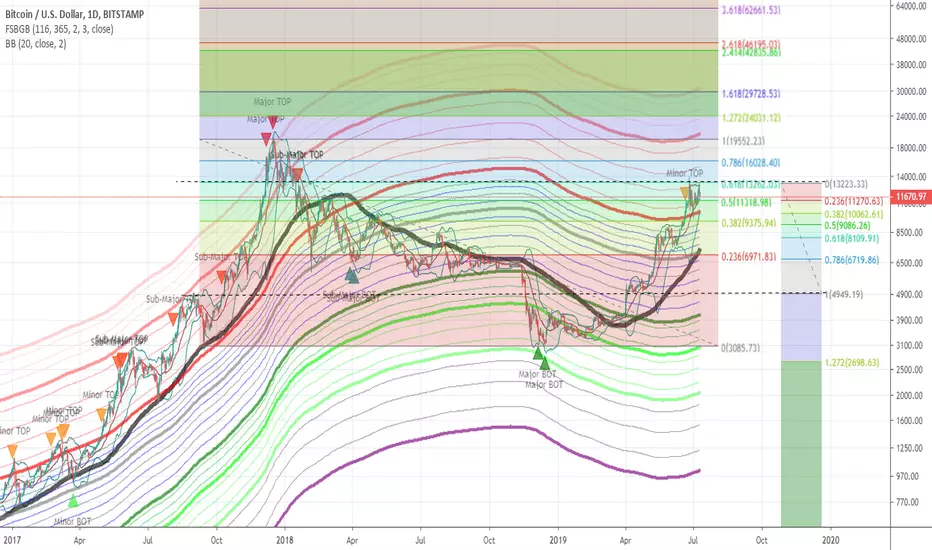
BTC presently expected to double top at 0.618 level of longer-term trend.
Expect BTC to fall back to around 8400 at 0.618 level of shorter-term trend.
Analysis rejected if double top fails, and BTC goes higher beyond and shows strong support above 14k.
See also:
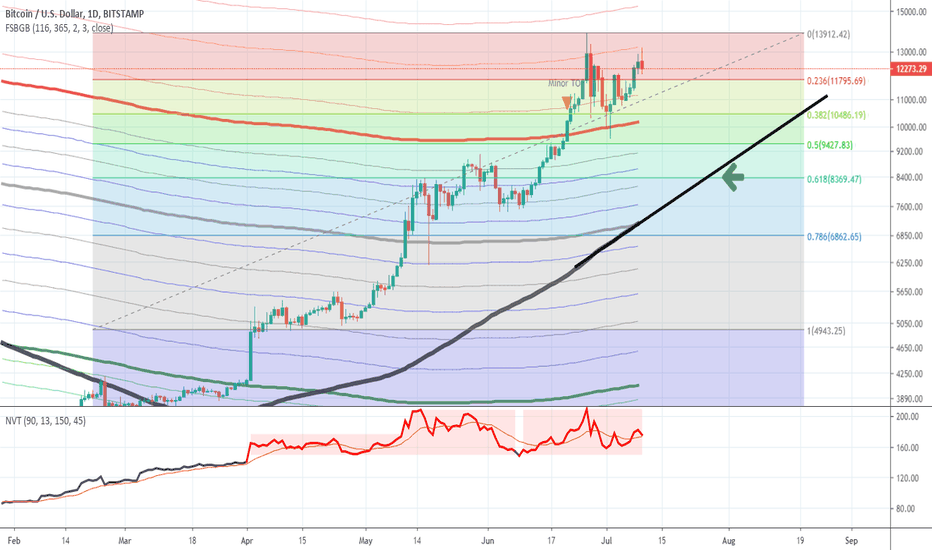
Expect BTC to fall back to around 8400 at 0.618 level of shorter-term trend.
Analysis rejected if double top fails, and BTC goes higher beyond and shows strong support above 14k.
See also:
ノート
Explaination: The FSBGB indicator shows that historically, we have presently reached a local top corresponding to the FSBGB-levels where local-tops were logged during the stage of the bull-market from 2016 till April of 2017, before the "red" FSBGB-level was eventually breached.ノート
Link to indicator used: tradingview.com/v/N0FyoIlB/
免責事項
これらの情報および投稿は、TradingViewが提供または承認する金融、投資、取引、またはその他の種類の助言もしくは推奨であることを意図したものではなく、またこれらに該当するものでもありません。詳細は利用規約をご覧ください。
免責事項
これらの情報および投稿は、TradingViewが提供または承認する金融、投資、取引、またはその他の種類の助言もしくは推奨であることを意図したものではなく、またこれらに該当するものでもありません。詳細は利用規約をご覧ください。