
Technical Analysis and Outlook:
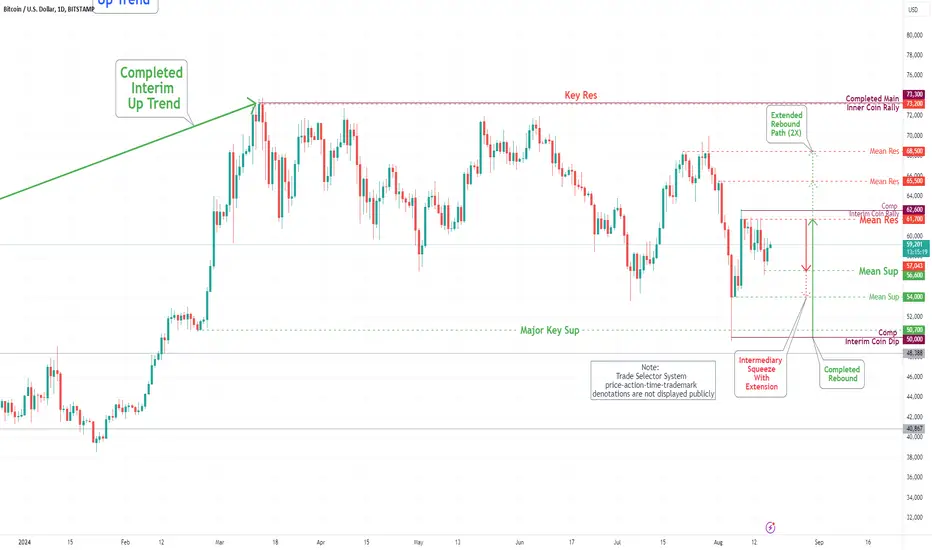
During this week's trading, Bitcoin underwent a retest of our Mean Resistance level of 61700 and, subsequently, the Mean Support level of 57400, marking the completion of the Interim Coin Rally at 62600. The presence of intermediary selling pressure may lead to a decline in the coin's price action toward the Mean Support level of 56600, 54000 and potentially result in a retesting of the completed Interim Coin Dip at 50000. On the positive side, the overall trend remains optimistic, with a focus on retesting the completed Interim Coin Rally at 62600 and potential extensions to the Mean Resistance levels of 65500 and 68500, respectively.
During this week's trading, Bitcoin underwent a retest of our Mean Resistance level of 61700 and, subsequently, the Mean Support level of 57400, marking the completion of the Interim Coin Rally at 62600. The presence of intermediary selling pressure may lead to a decline in the coin's price action toward the Mean Support level of 56600, 54000 and potentially result in a retesting of the completed Interim Coin Dip at 50000. On the positive side, the overall trend remains optimistic, with a focus on retesting the completed Interim Coin Rally at 62600 and potential extensions to the Mean Resistance levels of 65500 and 68500, respectively.

関連の投稿
免責事項
これらの情報および投稿は、TradingViewが提供または承認する金融、投資、取引、またはその他の種類の助言もしくは推奨であることを意図したものではなく、またこれらに該当するものでもありません。詳細は利用規約をご覧ください。
免責事項
これらの情報および投稿は、TradingViewが提供または承認する金融、投資、取引、またはその他の種類の助言もしくは推奨であることを意図したものではなく、またこれらに該当するものでもありません。詳細は利用規約をご覧ください。