
Description:
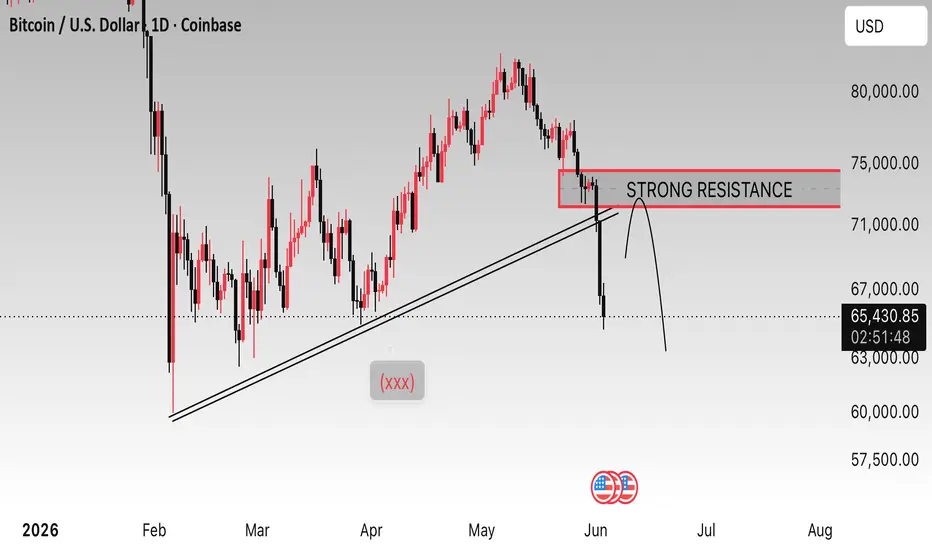
This daily Bitcoin (BTC/USD) chart shows a decisive rejection from a major resistance zone around $72,000–$74,000. Price has broken below a key ascending trendline that previously supported the uptrend, signaling weakening bullish momentum. The highlighted resistance area remains a critical level to watch, and any retest could attract renewed selling pressure. If the breakdown is confirmed, Bitcoin may face further downside toward lower support levels in the coming sessions.
Not financial advice

免責事項
これらの情報および投稿は、TradingViewが提供または承認する金融、投資、取引、またはその他の種類の助言もしくは推奨であることを意図したものではなく、またこれらに該当するものでもありません。詳細は利用規約をご覧ください。
免責事項
これらの情報および投稿は、TradingViewが提供または承認する金融、投資、取引、またはその他の種類の助言もしくは推奨であることを意図したものではなく、またこれらに該当するものでもありません。詳細は利用規約をご覧ください。