
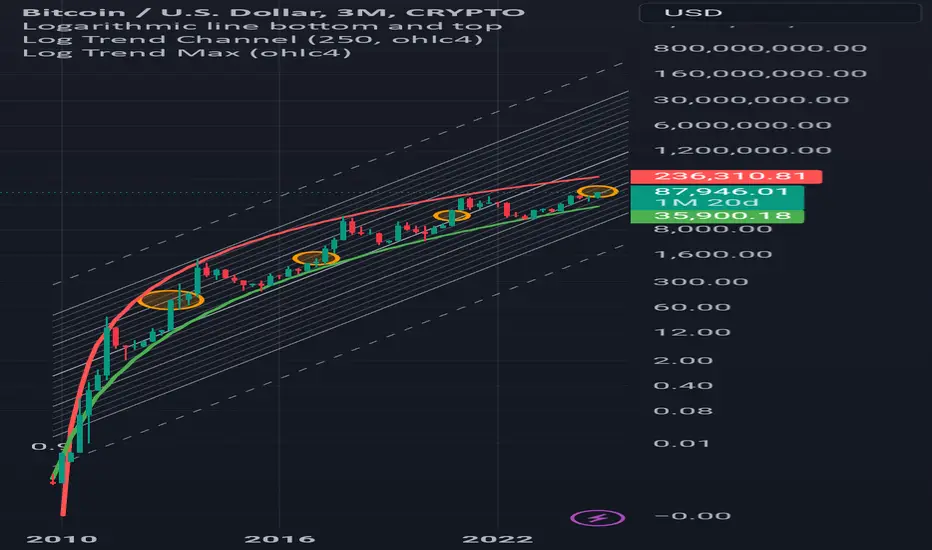
the quarterly chart in logarithmic price shows the cyclical arrangement of bull market breaks to new all time highs on the curve. the current bull market has the typical shape of each other breakout in the time cycles along a logarithmic pattern. shown are the logarithmic trend max and channel. this indicates a move inside the curve. during these periods btcusd tends to gain 80% over 3-6 months. im remaining buy sided btcusd for the foreseeable future targeting $124k by april 2025, stop loss as low as $59k.

関連の投稿
免責事項
これらの情報および投稿は、TradingViewが提供または承認する金融、投資、取引、またはその他の種類の助言もしくは推奨であることを意図したものではなく、またこれらに該当するものでもありません。詳細は利用規約をご覧ください。
免責事項
これらの情報および投稿は、TradingViewが提供または承認する金融、投資、取引、またはその他の種類の助言もしくは推奨であることを意図したものではなく、またこれらに該当するものでもありません。詳細は利用規約をご覧ください。