
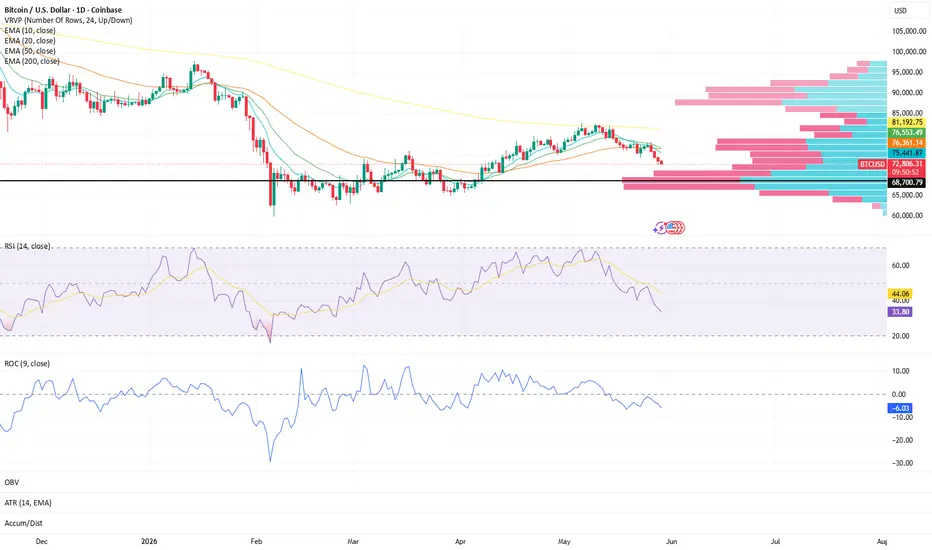
Bitcoin continues to face short-term pressure as momentum and trend alignment weaken.
The 10 EMA and 20 EMA have now crossed below the 50 EMA, signaling a deterioration in short-term trend structure
The 50 EMA remains overhead, acting as an important area to monitor for any recovery attempts
The 200 EMA continues to represent the broader trend reference point, remaining well above current price
Momentum conditions have also weakened:
RSI is currently near 34, reflecting continued selling pressure on the daily timeframe
ROC remains negative at -5.72, indicating momentum is still biased to the downside despite occasional stabilization attempts
Participation and momentum remain under pressure as price trades below key moving average resistance
What I'm Watching 👀
Whether price can stabilize near current levels or continue lower toward the Point of Control, where a significant amount of historical volume has been transacted
If the 10 and 20 EMAs begin flattening or continue accelerating lower
Whether RSI can begin recovering from current levels or remains under pressure
How momentum behaves as price approaches major volume-supported areas
At the moment, structure remains under pressure, with momentum and trend alignment favoring caution until signs of stabilization begin to emerge.
⭐️ Final Clarity Note ⭐️
This is a structure-based observation, not a prediction — focused on trend alignment, momentum behavior, participation, and liquidity positioning across key structural levels.

免責事項
これらの情報および投稿は、TradingViewが提供または承認する金融、投資、取引、またはその他の種類の助言もしくは推奨であることを意図したものではなく、またこれらに該当するものでもありません。詳細は利用規約をご覧ください。
免責事項
これらの情報および投稿は、TradingViewが提供または承認する金融、投資、取引、またはその他の種類の助言もしくは推奨であることを意図したものではなく、またこれらに該当するものでもありません。詳細は利用規約をご覧ください。