 BTC
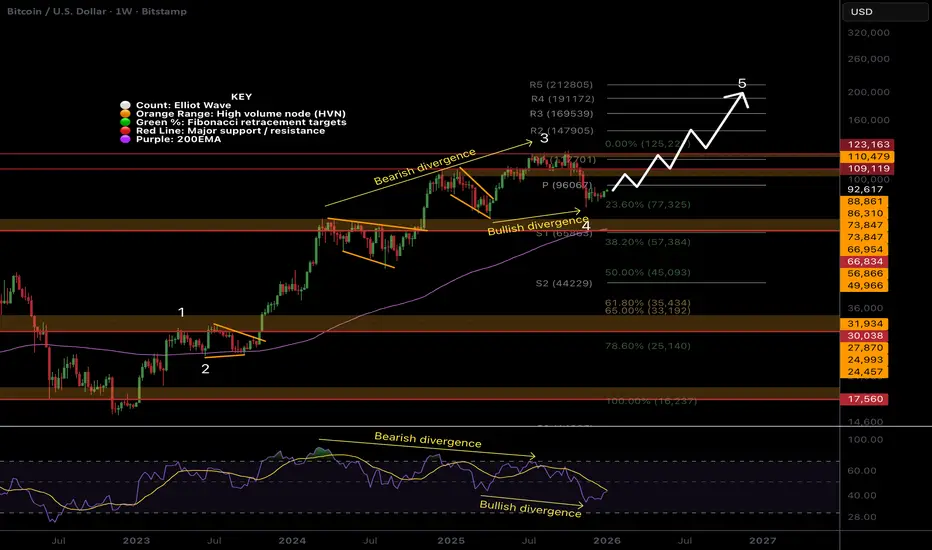
BTC🎯 Price remains in a shallow corrective phase, similar to previous price behaviour. Bitcoin remains up 420% since the 2023 bottom, and sentiment has never been this low for this long. Weekly RSI has now printed bullish divergence and tapped the weekly pivot, a strong bottoming signal. Wave 4 appears complete, wave 5 has a target of the weekly R4 pivot at $233000.
📈 Price is above the weekly 200EMA and pivot, demonstrating the bullish trend is intact. Weekly RSI bearish divergence has played out. Bitcoin RSI does not often reach oversold on the weekly.
👉 Analysis is invalidated below the weekly 200EMA, $73000
Safe trading

🎓 Behavioural Economist (PhD)
📈 Trader / Investor 15 years
👑 Unlock my trading plans: tradingblueprints.substack.com
🏆 Market Psychologist Newsletter: marketpsychologist.substack.com
📈 Trader / Investor 15 years
👑 Unlock my trading plans: tradingblueprints.substack.com
🏆 Market Psychologist Newsletter: marketpsychologist.substack.com
関連の投稿
免責事項
これらの情報および投稿は、TradingViewが提供または承認する金融、投資、取引、またはその他の種類の助言もしくは推奨であることを意図したものではなく、またこれらに該当するものでもありません。詳細は利用規約をご覧ください。
🎓 Behavioural Economist (PhD)
📈 Trader / Investor 15 years
👑 Unlock my trading plans: tradingblueprints.substack.com
🏆 Market Psychologist Newsletter: marketpsychologist.substack.com
📈 Trader / Investor 15 years
👑 Unlock my trading plans: tradingblueprints.substack.com
🏆 Market Psychologist Newsletter: marketpsychologist.substack.com
関連の投稿
免責事項
これらの情報および投稿は、TradingViewが提供または承認する金融、投資、取引、またはその他の種類の助言もしくは推奨であることを意図したものではなく、またこれらに該当するものでもありません。詳細は利用規約をご覧ください。