
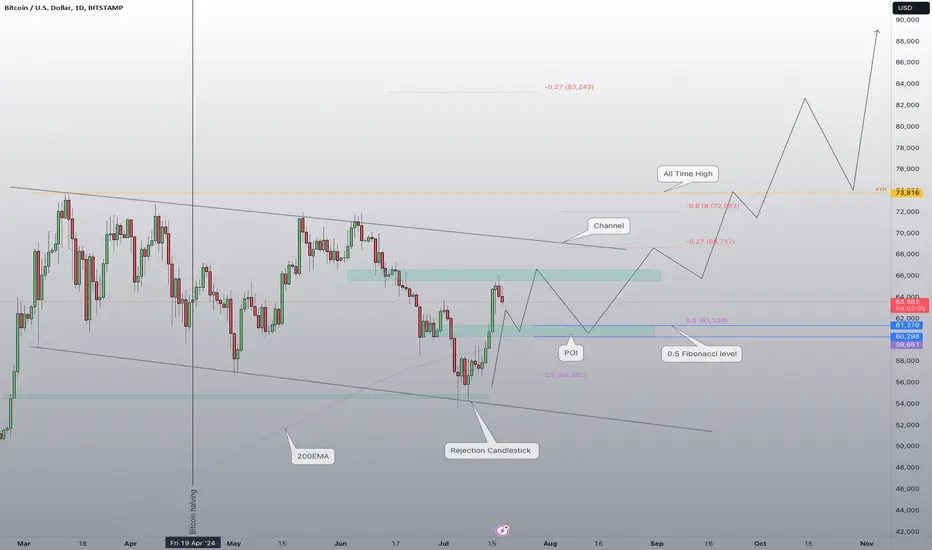
Bitcoin is currently experiencing a pullback after a bullish run lasting nine days. The next strong support zone is between $61,379 and $60,298. I anticipate Bitcoin will fall to this point of interest (POI), where we should see a reaction. There are multiple confluences suggesting a long setup, one of which is Bitcoin trading above the 200-day EMA, an important indicator of strength.

関連の投稿
免責事項
これらの情報および投稿は、TradingViewが提供または承認する金融、投資、取引、またはその他の種類の助言もしくは推奨であることを意図したものではなく、またこれらに該当するものでもありません。詳細は利用規約をご覧ください。
免責事項
これらの情報および投稿は、TradingViewが提供または承認する金融、投資、取引、またはその他の種類の助言もしくは推奨であることを意図したものではなく、またこれらに該当するものでもありません。詳細は利用規約をご覧ください。