
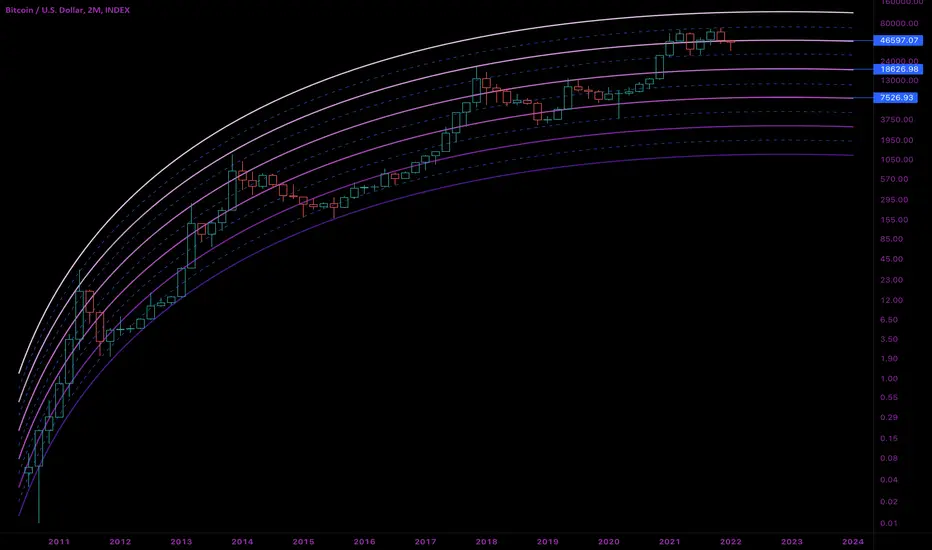
Not predictive analysis, just a quick reference with support and resistance levels marked across Bitcoin’s lifecycle. We are currently at a key resistance after bouncing from a mid-channel support.
I think this chart reflects reduced volatility since 2021, indicative of growing trust, maturity and liquidity.
I think this chart reflects reduced volatility since 2021, indicative of growing trust, maturity and liquidity.

免責事項
これらの情報および投稿は、TradingViewが提供または承認する金融、投資、取引、またはその他の種類の助言もしくは推奨であることを意図したものではなく、またこれらに該当するものでもありません。詳細は利用規約をご覧ください。
免責事項
これらの情報および投稿は、TradingViewが提供または承認する金融、投資、取引、またはその他の種類の助言もしくは推奨であることを意図したものではなく、またこれらに該当するものでもありません。詳細は利用規約をご覧ください。