
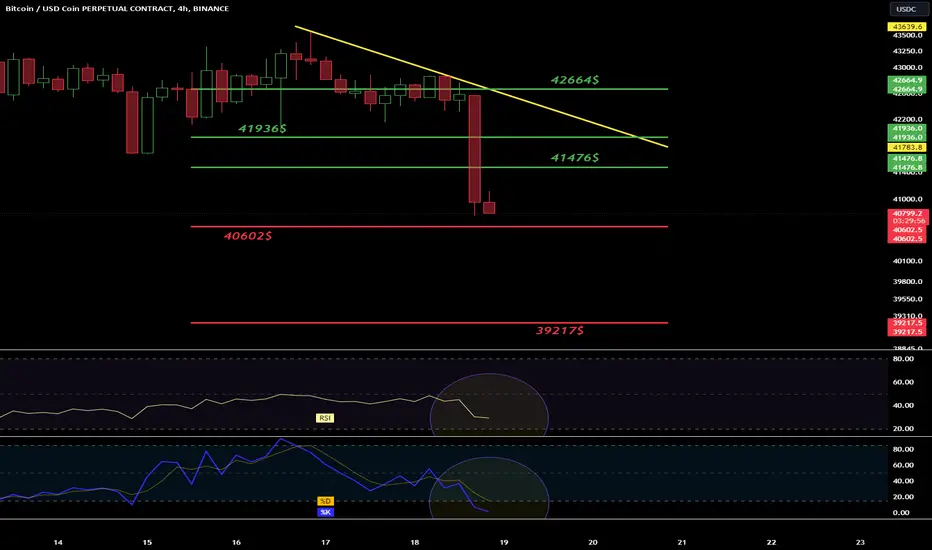
Hello everyone, let's take a look at the BTC to USDT chart on a one hour time frame. As you can see, the price has dropped significantly and remains below the downtrend line.
After unfolding the trend based fib extension grid, you can see support at $40,602, and then strong support at $39,217.
Looking the other way, we have resistance at $41,476, the second at $41,936, and the third strong resistance at $42,664.
The RSI shows room for the price to go lower, while the STOCH indicator is approaching the lower limit, which stopped the price decline.
After unfolding the trend based fib extension grid, you can see support at $40,602, and then strong support at $39,217.
Looking the other way, we have resistance at $41,476, the second at $41,936, and the third strong resistance at $42,664.
The RSI shows room for the price to go lower, while the STOCH indicator is approaching the lower limit, which stopped the price decline.

免責事項
これらの情報および投稿は、TradingViewが提供または承認する金融、投資、取引、またはその他の種類の助言もしくは推奨であることを意図したものではなく、またこれらに該当するものでもありません。詳細は利用規約をご覧ください。
免責事項
これらの情報および投稿は、TradingViewが提供または承認する金融、投資、取引、またはその他の種類の助言もしくは推奨であることを意図したものではなく、またこれらに該当するものでもありません。詳細は利用規約をご覧ください。