
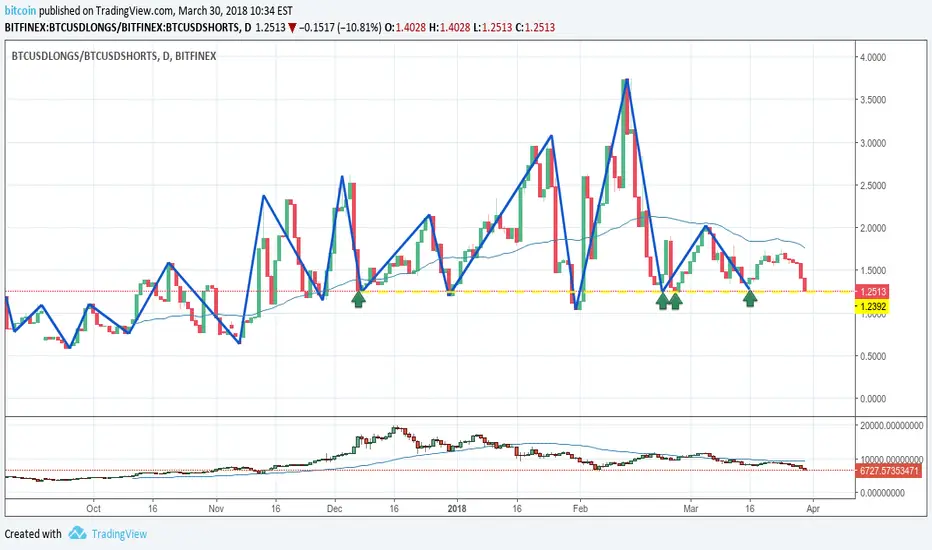
By taking longs/shorts ratio we get a cyclic chart and it is near past history lows. But as always it can break down on extreme panic sells and BTC is yet to see some panic like previous leg down to 6K. So I am sharing this as a point of attention.
ノート
Longs making a new high after hitting way lower than recent bottomsノート
Looks like a return to mean is probableノート
There is a double bottom so far, looking like it failed to bearish engulfing.ノート
double bottom lost, ratio is below 1 which means shorts are greater than longs, that's the lowest ratio in 2018ノート
Increasing bears margin with market going upwardノート
Bulls about to make a new higher high
免責事項
これらの情報および投稿は、TradingViewが提供または承認する金融、投資、取引、またはその他の種類の助言もしくは推奨であることを意図したものではなく、またこれらに該当するものでもありません。詳細は利用規約をご覧ください。
免責事項
これらの情報および投稿は、TradingViewが提供または承認する金融、投資、取引、またはその他の種類の助言もしくは推奨であることを意図したものではなく、またこれらに該当するものでもありません。詳細は利用規約をご覧ください。