
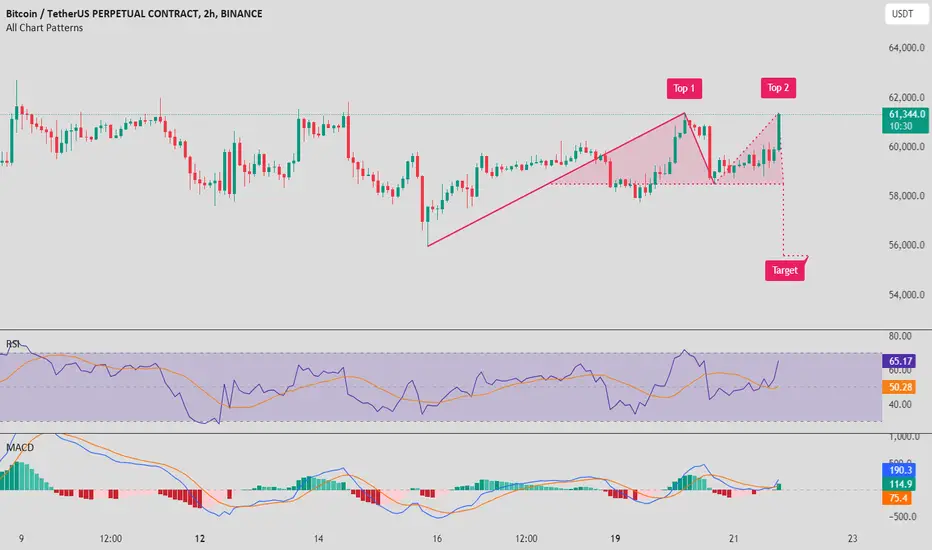
It looks like Bitcoin has formed a rising wedge pattern on the 2-hour chart, which typically indicates a potential bearish reversal. The pattern has already reached its second top, and the price seems to be breaking down from the wedge. The target for this breakdown could be around $56,000, which aligns with the support zone from earlier price action. The RSI is near overbought territory, suggesting that the momentum might be fading, and the MACD is showing early signs of a bearish crossover. Keep an eye on the volume to confirm this breakdown; if it picks up, we might see a sharper decline.

免責事項
これらの情報および投稿は、TradingViewが提供または承認する金融、投資、取引、またはその他の種類の助言もしくは推奨であることを意図したものではなく、またこれらに該当するものでもありません。詳細は利用規約をご覧ください。
免責事項
これらの情報および投稿は、TradingViewが提供または承認する金融、投資、取引、またはその他の種類の助言もしくは推奨であることを意図したものではなく、またこれらに該当するものでもありません。詳細は利用規約をご覧ください。