
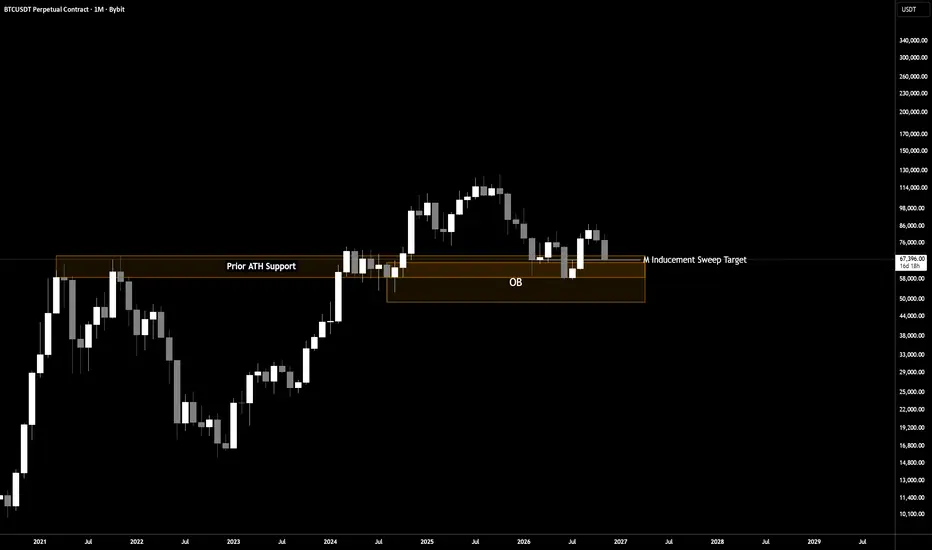
BTC is back at the top of its prior all-time-high support on the monthly chart. There is no setup here yet. This post is about what I'm watching and what would change that.
The bigger picture
The Prior ATH Support box marks the area of the 2021 highs. Old highs often turn into support, so it is the obvious place to expect buyers. Price has touched it several times in 2026 and has held so far. Below it sits an order block, an area where large orders may have waited before a strong move up. It is marked OB on the chart.
Why the obvious level can be bait
When a level has held more than once, many traders place buy orders near it and stop orders just below it. Those stops are liquidity, which means orders waiting to be filled. Price can run those stops first, then go to a deeper level before the real move. That is called inducement. It is a way to read the chart, not proof that it will happen. Sometimes the obvious support simply holds.
What the chart shows
On the chart I'm using, November's monthly candle opened at 77,511.20 and was trading at 66,932.20, down 13.65% on the month, with a low so far of 66,407.50. A monthly candle is not final until the month closes, so only the close counts.
The plan: IF THIS, THEN THAT
IF the monthly candle closes back above the Prior ATH Support box
THEN the support has held again, and the obvious level was the real one.
IF price trades below the 2026 lows and a monthly candle then closes back above them
THEN that is a sweep and reclaim: a brief take-out of the lows, then a turn back. I would then look for a CHoCH, a change of character, on a lower timeframe.
IF price sweeps the 2026 lows and reaches the OB, THEN that is the deeper level. I watch how price reacts there instead of guessing.
IF monthly candles close below the OB, THEN both levels have failed.
Where I'm wrong
If a month closes below the OB, my read that this area acts as support is wrong.
This is a slow chart. I expect the answer over the next few months, not days.
This is my analysis of the chart, not financial advice. Size your risk so being wrong is small.
The bigger picture
The Prior ATH Support box marks the area of the 2021 highs. Old highs often turn into support, so it is the obvious place to expect buyers. Price has touched it several times in 2026 and has held so far. Below it sits an order block, an area where large orders may have waited before a strong move up. It is marked OB on the chart.
Why the obvious level can be bait
When a level has held more than once, many traders place buy orders near it and stop orders just below it. Those stops are liquidity, which means orders waiting to be filled. Price can run those stops first, then go to a deeper level before the real move. That is called inducement. It is a way to read the chart, not proof that it will happen. Sometimes the obvious support simply holds.
What the chart shows
On the chart I'm using, November's monthly candle opened at 77,511.20 and was trading at 66,932.20, down 13.65% on the month, with a low so far of 66,407.50. A monthly candle is not final until the month closes, so only the close counts.
The plan: IF THIS, THEN THAT
IF the monthly candle closes back above the Prior ATH Support box
THEN the support has held again, and the obvious level was the real one.
IF price trades below the 2026 lows and a monthly candle then closes back above them
THEN that is a sweep and reclaim: a brief take-out of the lows, then a turn back. I would then look for a CHoCH, a change of character, on a lower timeframe.
IF price sweeps the 2026 lows and reaches the OB, THEN that is the deeper level. I watch how price reacts there instead of guessing.
IF monthly candles close below the OB, THEN both levels have failed.
Where I'm wrong
If a month closes below the OB, my read that this area acts as support is wrong.
This is a slow chart. I expect the answer over the next few months, not days.
This is my analysis of the chart, not financial advice. Size your risk so being wrong is small.

Charles Vincent · The Chart Whisperer · Free tape-reading guide and drill: chartwhisperer.ca/tape-reading · Free live class every Sunday, 22:00 UTC: chartwhisperer.ca/live · Tools and mentorship: chartwhisperer.ca
関連の投稿
免責事項
これらの情報および投稿は、TradingViewが提供または承認する金融、投資、取引、またはその他の種類の助言もしくは推奨であることを意図したものではなく、またこれらに該当するものでもありません。詳細は利用規約をご覧ください。
Charles Vincent · The Chart Whisperer · Free tape-reading guide and drill: chartwhisperer.ca/tape-reading · Free live class every Sunday, 22:00 UTC: chartwhisperer.ca/live · Tools and mentorship: chartwhisperer.ca
関連の投稿
免責事項
これらの情報および投稿は、TradingViewが提供または承認する金融、投資、取引、またはその他の種類の助言もしくは推奨であることを意図したものではなく、またこれらに該当するものでもありません。詳細は利用規約をご覧ください。