
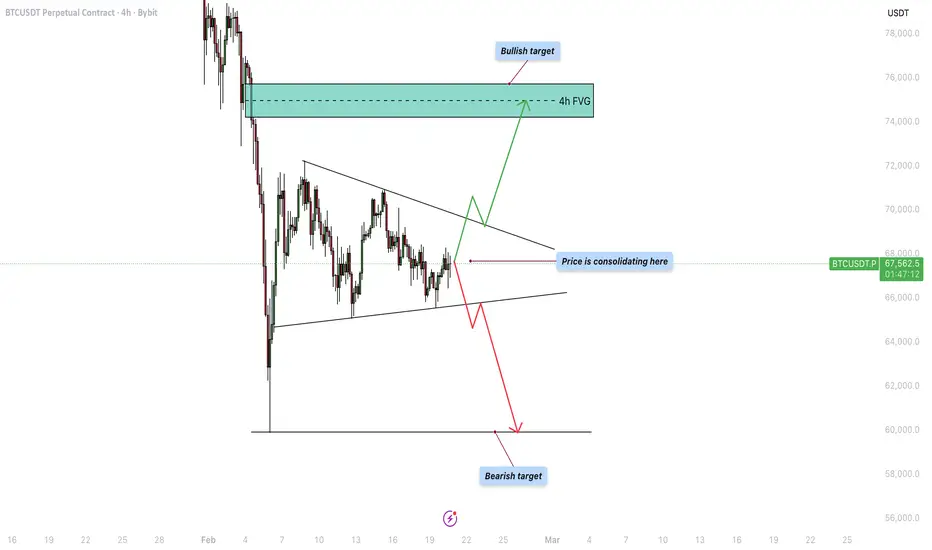
Bitcoin is currently trading around $67,600 on the 4-hour timeframe after a strong recovery from the previous sharp sell-off. The chart shows price compressing within a narrowing structure following the bounce from the lows near $60,000. Momentum has slowed, and the market is now consolidating beneath a higher-timeframe resistance zone. This compression suggests that a larger move is approaching, with both bullish and bearish scenarios clearly defined.
Consolidation Pattern
Price is forming a clear consolidation pattern, bounded by a descending resistance trendline and a rising support trendline. This creates a tightening wedge structure, signaling reduced volatility and equilibrium between buyers and sellers. The market has been printing higher lows while simultaneously making lower highs, reflecting indecision. This type of compression often precedes expansion. As price approaches the apex of the structure, a breakout becomes increasingly likely, and the direction of that breakout will determine the next impulsive phase.
Bullish Target
If Bitcoin breaks above the descending resistance trendline with strength, the next logical target lies within the 4-hour bearish FVG around the $74,000–$76,000 region. This zone represents a previous imbalance where heavy selling occurred. A breakout from consolidation combined with sustained momentum could drive price toward this imbalance, as markets are naturally drawn to inefficiencies. A successful reclaim and hold above the upper trendline would signal that buyers are regaining control and that the bullish expansion phase is underway.
Bearish Target
On the downside, a breakdown below the rising support trendline would invalidate the short-term bullish structure. In that case, the primary bearish target sits near the $60,000 level, where previous strong demand entered the market. This area represents a key horizontal support and liquidity pool. A move toward this level would likely involve increased volatility and momentum, especially if the breakdown occurs with strong volume.
Final Thoughts
Bitcoin is at a decision point. The consolidation pattern reflects a market building pressure for a larger move. While the broader recovery from $60,000 keeps the structure relatively constructive, the inability to break higher so far keeps downside risk present. A confirmed breakout above resistance favors a move toward the 4-hour FVG around $75,000, while a breakdown below support opens the door to a retest of $60,000. The next impulsive candle outside of this structure will likely set the tone for the coming sessions.
-------------------------
Thanks for your support. If you enjoyed this analysis, make sure to follow me so you don't miss the next one. And if you found it helpful, feel free to drop a like 👍 and leave a comment 💬, I’d love to hear your thoughts!
Consolidation Pattern
Price is forming a clear consolidation pattern, bounded by a descending resistance trendline and a rising support trendline. This creates a tightening wedge structure, signaling reduced volatility and equilibrium between buyers and sellers. The market has been printing higher lows while simultaneously making lower highs, reflecting indecision. This type of compression often precedes expansion. As price approaches the apex of the structure, a breakout becomes increasingly likely, and the direction of that breakout will determine the next impulsive phase.
Bullish Target
If Bitcoin breaks above the descending resistance trendline with strength, the next logical target lies within the 4-hour bearish FVG around the $74,000–$76,000 region. This zone represents a previous imbalance where heavy selling occurred. A breakout from consolidation combined with sustained momentum could drive price toward this imbalance, as markets are naturally drawn to inefficiencies. A successful reclaim and hold above the upper trendline would signal that buyers are regaining control and that the bullish expansion phase is underway.
Bearish Target
On the downside, a breakdown below the rising support trendline would invalidate the short-term bullish structure. In that case, the primary bearish target sits near the $60,000 level, where previous strong demand entered the market. This area represents a key horizontal support and liquidity pool. A move toward this level would likely involve increased volatility and momentum, especially if the breakdown occurs with strong volume.
Final Thoughts
Bitcoin is at a decision point. The consolidation pattern reflects a market building pressure for a larger move. While the broader recovery from $60,000 keeps the structure relatively constructive, the inability to break higher so far keeps downside risk present. A confirmed breakout above resistance favors a move toward the 4-hour FVG around $75,000, while a breakdown below support opens the door to a retest of $60,000. The next impulsive candle outside of this structure will likely set the tone for the coming sessions.
-------------------------
Thanks for your support. If you enjoyed this analysis, make sure to follow me so you don't miss the next one. And if you found it helpful, feel free to drop a like 👍 and leave a comment 💬, I’d love to hear your thoughts!
トレード稼働中

🔸 Free trading Discord
discord.gg/FJ27nSSBvC
🔹 Free trading signals
t.me/CandleCollective
discord.gg/FJ27nSSBvC
🔹 Free trading signals
t.me/CandleCollective
免責事項
これらの情報および投稿は、TradingViewが提供または承認する金融、投資、取引、またはその他の種類の助言もしくは推奨であることを意図したものではなく、またこれらに該当するものでもありません。詳細は利用規約をご覧ください。
🔸 Free trading Discord
discord.gg/FJ27nSSBvC
🔹 Free trading signals
t.me/CandleCollective
discord.gg/FJ27nSSBvC
🔹 Free trading signals
t.me/CandleCollective
免責事項
これらの情報および投稿は、TradingViewが提供または承認する金融、投資、取引、またはその他の種類の助言もしくは推奨であることを意図したものではなく、またこれらに該当するものでもありません。詳細は利用規約をご覧ください。