
BTCUSDT — Final Correction Before Explosive Rally to New ATH?
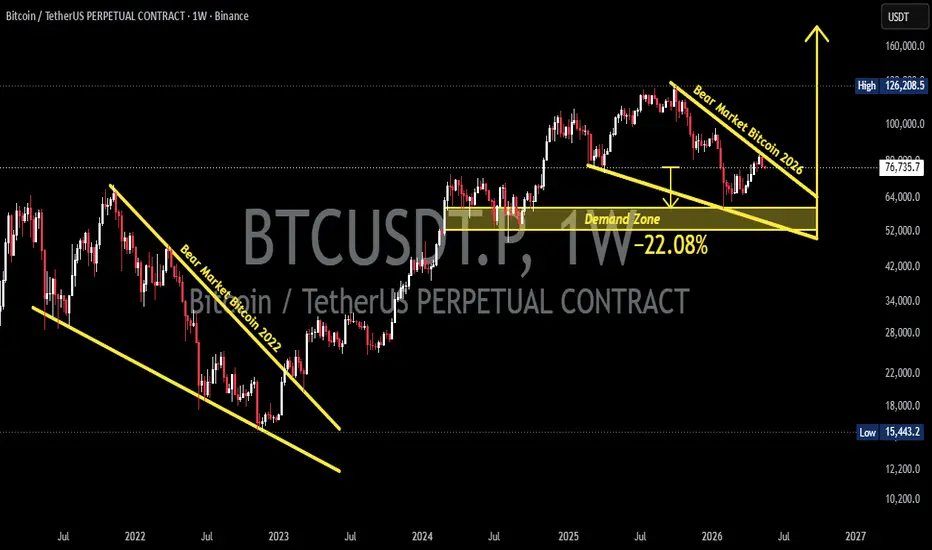
This BTCUSDT 1W timeframe chart shows a very interesting structure because it has strong similarities to the 2022 Bitcoin Bear Market pattern 🐻📉. Currently, the price action appears to be forming a major corrective structure after failing to maintain the previous ATH area.
The chart shows:
- 🔻 Descending resistance (downtrend line)
- 🟨 Strong Demand Zone around $60,000 — $52,500
- 📉 A correction structure of around -22%
- ⚠️ Potential fake breakdown before a major bullish expansion
The yellow zone between $60K — $52.5K is becoming the most important area in determining Bitcoin’s next direction 🧭💰
---
📉 Chart Structure Analysis
The current structure is forming a:
🔻 Falling Wedge / Descending Broadening Structure
This pattern often appears when the market enters a distribution phase or the final stage of a correction before a major reversal happens 🔄📊
Characteristics visible on the chart:
- 📉 Continuous Lower High formation
- 🐻 Selling pressure starting to weaken
- 🎯 Price moving toward a major demand zone
- 📊 Volatility beginning to tighten
Historically, structures like this on Bitcoin often end with:
1. 💧 Liquidity sweep to the downside
2. 🔄 Support reclaim
3. 🚀 Explosive breakout upward
---
🟨 Major BTC Demand Zone
Yellow Zone:
💰 $60,000 — $52,500
This area represents:
- 🛡️ Strong weekly support
- 🏦 Potential re-accumulation zone
- 🧠 Psychological market area
- 📈 Mid-term bullish validation zone
As long as BTC remains above this area, the macro bullish structure is still considered valid ✅🐂
---
🚀 Bullish Scenario
✅ Bullish Scenario
If BTC can:
- 📍 Hold above the $60K — $52.5K demand zone
- 🔥 Break out from the descending resistance
- 📈 Form a new Higher High
Then the potential move could be:
- 🎯 Re-test the previous ATH
- 🚀 Continue bullish expansion
- 💎 Move toward a new psychological area above $120K
The chart even illustrates the possibility of a massive impulsive rally after the correction phase is completed ⚡📈
Bullish momentum would become even stronger if breakout volume increases and weekly candles close back above the resistance trendline 📊🔥
---
🐻 Bearish Scenario
❌ Bearish Scenario
If BTC fails to hold the demand zone:
- 📉 Breakdown below $52.5K
- ⚠️ Weekly close below major support
- 🩸 Seller volume increases significantly
Then the market could enter a deeper correction phase:
- 🌊 Large liquidity sweep
- 😨 Panic selling
- 📍 Retest of the next macro support
However, as long as there is no valid breakdown below the demand zone, this area is still considered a strong institutional buyback zone 🏦🟨
---
🧠 Conclusion
BTC is currently at a crucial area that could determine the market direction for the next several months ⏳📊
The chart structure shows similarities to the previous bear market phase, but it also opens the possibility of forming a:
⚡ “Final Shakeout Before Massive Bull Run” 🚀🐂
The $60K — $52.5K demand zone is the most important area to monitor because it could become a major reversal point if buyers regain market dominance 💰📈
---
#BTC #Bitcoin #BTCUSDT #Crypto #Cryptocurrency #TradingView #TechnicalAnalysis #PriceAction #SmartMoney #SupplyDemand #BitcoinAnalysis #CryptoTrading #BullRun #BearMarket #BTCAnalysis #Altcoin #MarketStructure #Trader #Investing #WeeklyChart
The chart shows:
- 🔻 Descending resistance (downtrend line)
- 🟨 Strong Demand Zone around $60,000 — $52,500
- 📉 A correction structure of around -22%
- ⚠️ Potential fake breakdown before a major bullish expansion
The yellow zone between $60K — $52.5K is becoming the most important area in determining Bitcoin’s next direction 🧭💰
---
📉 Chart Structure Analysis
The current structure is forming a:
🔻 Falling Wedge / Descending Broadening Structure
This pattern often appears when the market enters a distribution phase or the final stage of a correction before a major reversal happens 🔄📊
Characteristics visible on the chart:
- 📉 Continuous Lower High formation
- 🐻 Selling pressure starting to weaken
- 🎯 Price moving toward a major demand zone
- 📊 Volatility beginning to tighten
Historically, structures like this on Bitcoin often end with:
1. 💧 Liquidity sweep to the downside
2. 🔄 Support reclaim
3. 🚀 Explosive breakout upward
---
🟨 Major BTC Demand Zone
Yellow Zone:
💰 $60,000 — $52,500
This area represents:
- 🛡️ Strong weekly support
- 🏦 Potential re-accumulation zone
- 🧠 Psychological market area
- 📈 Mid-term bullish validation zone
As long as BTC remains above this area, the macro bullish structure is still considered valid ✅🐂
---
🚀 Bullish Scenario
✅ Bullish Scenario
If BTC can:
- 📍 Hold above the $60K — $52.5K demand zone
- 🔥 Break out from the descending resistance
- 📈 Form a new Higher High
Then the potential move could be:
- 🎯 Re-test the previous ATH
- 🚀 Continue bullish expansion
- 💎 Move toward a new psychological area above $120K
The chart even illustrates the possibility of a massive impulsive rally after the correction phase is completed ⚡📈
Bullish momentum would become even stronger if breakout volume increases and weekly candles close back above the resistance trendline 📊🔥
---
🐻 Bearish Scenario
❌ Bearish Scenario
If BTC fails to hold the demand zone:
- 📉 Breakdown below $52.5K
- ⚠️ Weekly close below major support
- 🩸 Seller volume increases significantly
Then the market could enter a deeper correction phase:
- 🌊 Large liquidity sweep
- 😨 Panic selling
- 📍 Retest of the next macro support
However, as long as there is no valid breakdown below the demand zone, this area is still considered a strong institutional buyback zone 🏦🟨
---
🧠 Conclusion
BTC is currently at a crucial area that could determine the market direction for the next several months ⏳📊
The chart structure shows similarities to the previous bear market phase, but it also opens the possibility of forming a:
⚡ “Final Shakeout Before Massive Bull Run” 🚀🐂
The $60K — $52.5K demand zone is the most important area to monitor because it could become a major reversal point if buyers regain market dominance 💰📈
---
#BTC #Bitcoin #BTCUSDT #Crypto #Cryptocurrency #TradingView #TechnicalAnalysis #PriceAction #SmartMoney #SupplyDemand #BitcoinAnalysis #CryptoTrading #BullRun #BearMarket #BTCAnalysis #Altcoin #MarketStructure #Trader #Investing #WeeklyChart

✅ Get Free Signals! Join Our Telegram Channel Here: t.me/TheCryptoNuclear
✅ Twitter: twitter.com/crypto_nuclear
✅ Join Bybit : partner.bybit.com/b/nuclearvip
✅ Benefits : Lifetime Trading Fee Discount -50%
✅ Twitter: twitter.com/crypto_nuclear
✅ Join Bybit : partner.bybit.com/b/nuclearvip
✅ Benefits : Lifetime Trading Fee Discount -50%
免責事項
これらの情報および投稿は、TradingViewが提供または承認する金融、投資、取引、またはその他の種類の助言もしくは推奨であることを意図したものではなく、またこれらに該当するものでもありません。詳細は利用規約をご覧ください。
✅ Get Free Signals! Join Our Telegram Channel Here: t.me/TheCryptoNuclear
✅ Twitter: twitter.com/crypto_nuclear
✅ Join Bybit : partner.bybit.com/b/nuclearvip
✅ Benefits : Lifetime Trading Fee Discount -50%
✅ Twitter: twitter.com/crypto_nuclear
✅ Join Bybit : partner.bybit.com/b/nuclearvip
✅ Benefits : Lifetime Trading Fee Discount -50%
免責事項
これらの情報および投稿は、TradingViewが提供または承認する金融、投資、取引、またはその他の種類の助言もしくは推奨であることを意図したものではなく、またこれらに該当するものでもありません。詳細は利用規約をご覧ください。