
Greetings, everyone.😉
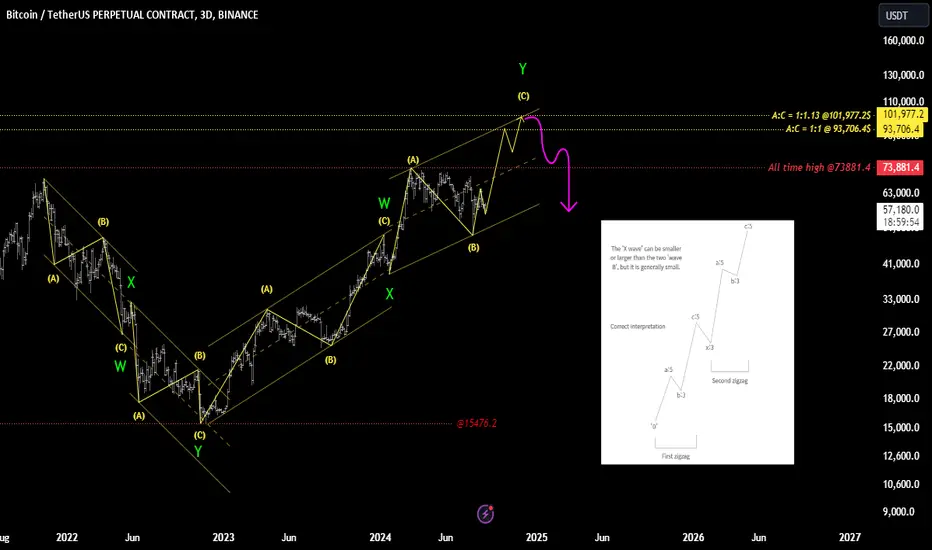
I would like to present a scenario for your consideration, grounded in "Elliott Wave Theory".
[Recent Chart Zoomed In]

✔️ Wave initiated from the 15K level: Classified as a "Double Zigzag"
✔️ Current wave in development: Y-c-3
✔️ Projected upward range: 93K ~ 101K
The rationale behind this analysis is as follows:
Based on these observations, I have constructed this particular scenario. It is an illustrative representation of potential market behavior, grounded in established technical principles.
Wishing you all the best of luck🍀
I would like to present a scenario for your consideration, grounded in "Elliott Wave Theory".
[Recent Chart Zoomed In]
✔️ Wave initiated from the 15K level: Classified as a "Double Zigzag"
✔️ Current wave in development: Y-c-3
✔️ Projected upward range: 93K ~ 101K
The rationale behind this analysis is as follows:
- Zigzag patterns typically move within a parallel channel.
- The first zigzag wave, which started from the 15K level, adhered precisely to this parallel channel.
- As a result, the likelihood of a complex correction occurring is considerably high.
Based on these observations, I have constructed this particular scenario. It is an illustrative representation of potential market behavior, grounded in established technical principles.
Wishing you all the best of luck🍀
- This is not a buy or sell recommendation.
- It is a personal perspective and should be used for reference only.
- All decisions and responsibilities lie with you.

関連の投稿
免責事項
これらの情報および投稿は、TradingViewが提供または承認する金融、投資、取引、またはその他の種類の助言もしくは推奨であることを意図したものではなく、またこれらに該当するものでもありません。詳細は利用規約をご覧ください。
免責事項
これらの情報および投稿は、TradingViewが提供または承認する金融、投資、取引、またはその他の種類の助言もしくは推奨であることを意図したものではなく、またこれらに該当するものでもありません。詳細は利用規約をご覧ください。