Context: 
 BTCUSDT.P — Fractal Read: 3M vs 1W vs 1M
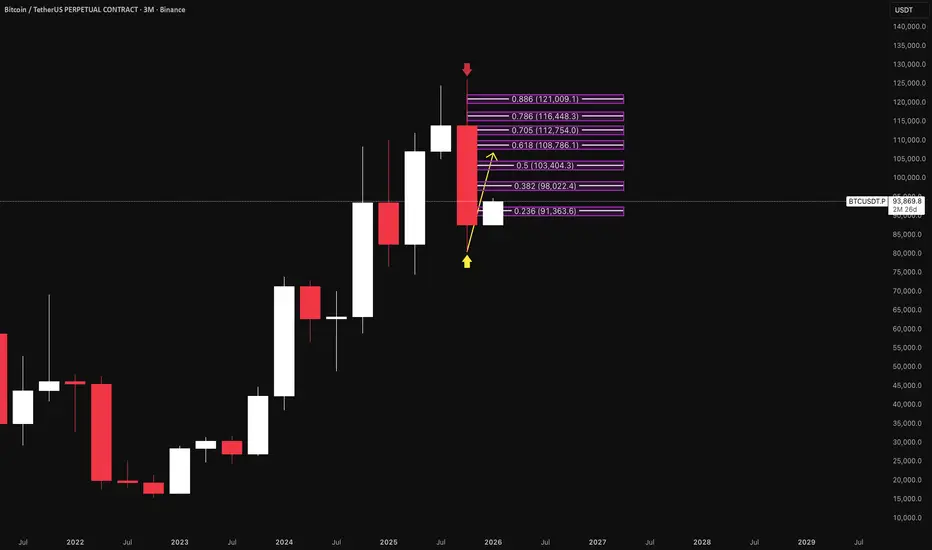
We’re at a classic HTF inflection where a potential 3M higher-low is trying to build, while the weekly/monthly tape still carries “distribution-risk” characteristics (H&S framework + reclaim requirements). Timeframes are fractal — one triggers the next.
---

3M: Higher-low attempt is live, but needs confirmation
The 3-month structure is attempting to stabilize after the impulsive sell leg. A higher-low is not “declared” by a bounce — it’s confirmed by:
1) Holding the base (no acceptance back below the pivot zone)
2) Reclaiming overhead supply shelves with follow-through
3) Showing improving participation (volume) on impulse legs
I’m treating this as a developing base, not a certainty. My edge is scenario planning, not bottom calling.
---

1W: EMA posture + fib shelves + H&S risk management
(EMAs: 12 blue / 26 orange / 50 white / 200 red)
On the weekly, the market is still trading below key EMA “control lines” (notably the faster/mid EMAs), which makes the current bounce a *retest environment* until proven otherwise.
Fibonacci (swing high → swing low) provides the reaction shelves that matter for a right-shoulder build or a proper reclaim:
• 0.236 ~ 91.36k (first reclaim shelf)
• 0.382 ~ 98.02k (first serious acceptance test)
• 0.50 ~ 103.40k (midpoint / decision shelf)
• 0.618 ~ 108.79k (often the “make-or-break” supply zone)
• 0.705 ~ 112.75k
• 0.786 ~ 116.45k
• 0.886 ~ 121.01k
H&S framework:
- The structure suggests a potential weekly head-and-shoulders with an ascending neckline.
- For confirmation, I watch the tape: rallies into the right-shoulder area often show weaker participation (volume not confirming), and breakdown attempts typically require expansion in sell-side participation.
- If price rises while buy volume trends lower, that’s a warning for “bounce = distribution” and increases the probability this is a right-shoulder auction rather than a trend resumption.
Invalidation logic:
- The H&S threat diminishes materially only after sustained acceptance above the heavier supply shelves (not just a wick into them).
---

1M: Zoomed-out H&S = bear-trap potential during the bounce
On the monthly, the pattern is cleaner: the current rebound can absolutely function as a “bear-trap / relief rally” while the right shoulder develops.
That’s why I treat upside as a sequence of auctions:
- Acceptance above each fib shelf = constructive
- Fast rejection / failure to hold reclaimed levels = supply is still in control
If the rebound fails to convert those shelves into support, the market can rotate back toward the base and re-open the larger corrective fractal.
---

Long/Short Accounts %: liquidity context (and cross-exchange check)
I use Long/Short Accounts % as a positioning/behavioral overlay, not as a standalone signal.
As price tags each fib shelf and the H&S structure “matures,” I’m watching:
- Long skew rising into resistance shelves = potential liquidity for sell-side (crowd leaning the wrong way)
- Short skew rising into support = squeeze risk (fuel for continuation moves)
I also compare the read across venues (e.g., Binance vs Bybit). If both venues show the same crowding at the same shelf, the “liquidity magnet” effect tends to be cleaner.
---
Summary: what matters next
- Base must hold to keep the 3M higher-low thesis alive.
- Weekly/monthly must reclaim and ACCEPT above the fib/EMA shelves to reduce H&S distribution risk.
- Volume + acceptance (HTF closes) decide whether this is genuine bid strength or a right-shoulder trap.
---
Educational commentary only — not financial advice.
BTCUSDT.P — Fractal Read: 3M vs 1W vs 1MWe’re at a classic HTF inflection where a potential 3M higher-low is trying to build, while the weekly/monthly tape still carries “distribution-risk” characteristics (H&S framework + reclaim requirements). Timeframes are fractal — one triggers the next.
---
3M: Higher-low attempt is live, but needs confirmation
The 3-month structure is attempting to stabilize after the impulsive sell leg. A higher-low is not “declared” by a bounce — it’s confirmed by:
1) Holding the base (no acceptance back below the pivot zone)
2) Reclaiming overhead supply shelves with follow-through
3) Showing improving participation (volume) on impulse legs
I’m treating this as a developing base, not a certainty. My edge is scenario planning, not bottom calling.
---
1W: EMA posture + fib shelves + H&S risk management
(EMAs: 12 blue / 26 orange / 50 white / 200 red)
On the weekly, the market is still trading below key EMA “control lines” (notably the faster/mid EMAs), which makes the current bounce a *retest environment* until proven otherwise.
Fibonacci (swing high → swing low) provides the reaction shelves that matter for a right-shoulder build or a proper reclaim:
• 0.236 ~ 91.36k (first reclaim shelf)
• 0.382 ~ 98.02k (first serious acceptance test)
• 0.50 ~ 103.40k (midpoint / decision shelf)
• 0.618 ~ 108.79k (often the “make-or-break” supply zone)
• 0.705 ~ 112.75k
• 0.786 ~ 116.45k
• 0.886 ~ 121.01k
H&S framework:
- The structure suggests a potential weekly head-and-shoulders with an ascending neckline.
- For confirmation, I watch the tape: rallies into the right-shoulder area often show weaker participation (volume not confirming), and breakdown attempts typically require expansion in sell-side participation.
- If price rises while buy volume trends lower, that’s a warning for “bounce = distribution” and increases the probability this is a right-shoulder auction rather than a trend resumption.
Invalidation logic:
- The H&S threat diminishes materially only after sustained acceptance above the heavier supply shelves (not just a wick into them).
---
1M: Zoomed-out H&S = bear-trap potential during the bounce
On the monthly, the pattern is cleaner: the current rebound can absolutely function as a “bear-trap / relief rally” while the right shoulder develops.
That’s why I treat upside as a sequence of auctions:
- Acceptance above each fib shelf = constructive
- Fast rejection / failure to hold reclaimed levels = supply is still in control
If the rebound fails to convert those shelves into support, the market can rotate back toward the base and re-open the larger corrective fractal.
---
Long/Short Accounts %: liquidity context (and cross-exchange check)
I use Long/Short Accounts % as a positioning/behavioral overlay, not as a standalone signal.
As price tags each fib shelf and the H&S structure “matures,” I’m watching:
- Long skew rising into resistance shelves = potential liquidity for sell-side (crowd leaning the wrong way)
- Short skew rising into support = squeeze risk (fuel for continuation moves)
I also compare the read across venues (e.g., Binance vs Bybit). If both venues show the same crowding at the same shelf, the “liquidity magnet” effect tends to be cleaner.
---
Summary: what matters next
- Base must hold to keep the 3M higher-low thesis alive.
- Weekly/monthly must reclaim and ACCEPT above the fib/EMA shelves to reduce H&S distribution risk.
- Volume + acceptance (HTF closes) decide whether this is genuine bid strength or a right-shoulder trap.
---
Educational commentary only — not financial advice.

免責事項
これらの情報および投稿は、TradingViewが提供または承認する金融、投資、取引、またはその他の種類の助言もしくは推奨であることを意図したものではなく、またこれらに該当するものでもありません。詳細は利用規約をご覧ください。
免責事項
これらの情報および投稿は、TradingViewが提供または承認する金融、投資、取引、またはその他の種類の助言もしくは推奨であることを意図したものではなく、またこれらに該当するものでもありません。詳細は利用規約をご覧ください。