TR 
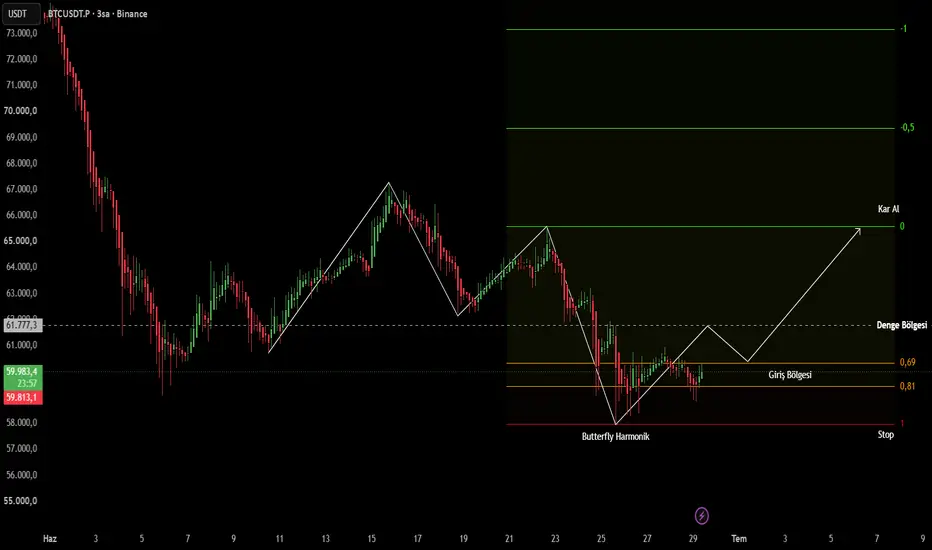
 BTCUSDT 3 saatlik grafikte düşüş trendinin son likidite alımının ardından fiyatın dip bölgede güçlü bir Butterfly (Kelebek) Harmonik Formasyonu oluşturduğu görülmektedir.
Fiyatın bu dipten başlattığı ilk tepki hareketinin ardından düzeltmesini yaptığı 0.69 - 0.81 Fibonacci optimizasyon bandı, long yönlü pozisyona dahil olmak için asimetrik bir risk/ödül oranı sunmaktadır. Formasyonun iptal seviyesi (1 çizgisi) stop kabul edilerek, üst taraftaki majör direnç yapısı hedeflenmiştir.
Giriş Alanı: 0.69 - 0.81 Kutusu
Stop-Loss: 1 Seviyesi altı (3S mum kapanışı)
Ana Hedef (TP): 65.500 (0 Seviyesi)
ENG Following the completion of the previous bearish expansion, BTCUSDT has tapped into a major HTF demand area on the 3-hour chart, printing a high-probability Butterfly Harmonic Pattern.
The initial reaction from the absolute bottom shows early signs of a trend reversal. The subsequent corrective pullback into our optimized entry window—the 0.69 - 0.81 Fibonacci retracement zone—provides an asymmetric risk-to-reward ratio (R:R > 1:4) for a long positioning.
While navigating this counter-trend setup, maintaining strict risk discipline remains paramount. The invalidation level is clearly defined just below the harmonic completion point.
Entry Zone: 0.69 - 0.81 Optimisation Box (Current Consolidation Area)
Stop-Loss: Just below Level 1 (Invalidation point on 3H close)
Take-Profit (TP): 65,500 (Level 0 / Major Supply & Equilibrium)
#bitcoin #btcusdt #harmonic #butterfly #long #priceaction
BTCUSDT 3 saatlik grafikte düşüş trendinin son likidite alımının ardından fiyatın dip bölgede güçlü bir Butterfly (Kelebek) Harmonik Formasyonu oluşturduğu görülmektedir.Fiyatın bu dipten başlattığı ilk tepki hareketinin ardından düzeltmesini yaptığı 0.69 - 0.81 Fibonacci optimizasyon bandı, long yönlü pozisyona dahil olmak için asimetrik bir risk/ödül oranı sunmaktadır. Formasyonun iptal seviyesi (1 çizgisi) stop kabul edilerek, üst taraftaki majör direnç yapısı hedeflenmiştir.
Giriş Alanı: 0.69 - 0.81 Kutusu
Stop-Loss: 1 Seviyesi altı (3S mum kapanışı)
Ana Hedef (TP): 65.500 (0 Seviyesi)
ENG Following the completion of the previous bearish expansion, BTCUSDT has tapped into a major HTF demand area on the 3-hour chart, printing a high-probability Butterfly Harmonic Pattern.
The initial reaction from the absolute bottom shows early signs of a trend reversal. The subsequent corrective pullback into our optimized entry window—the 0.69 - 0.81 Fibonacci retracement zone—provides an asymmetric risk-to-reward ratio (R:R > 1:4) for a long positioning.
While navigating this counter-trend setup, maintaining strict risk discipline remains paramount. The invalidation level is clearly defined just below the harmonic completion point.
Entry Zone: 0.69 - 0.81 Optimisation Box (Current Consolidation Area)
Stop-Loss: Just below Level 1 (Invalidation point on 3H close)
Take-Profit (TP): 65,500 (Level 0 / Major Supply & Equilibrium)
#bitcoin #btcusdt #harmonic #butterfly #long #priceaction

関連の投稿
免責事項
これらの情報および投稿は、TradingViewが提供または承認する金融、投資、取引、またはその他の種類の助言もしくは推奨であることを意図したものではなく、またこれらに該当するものでもありません。詳細は利用規約をご覧ください。
免責事項
これらの情報および投稿は、TradingViewが提供または承認する金融、投資、取引、またはその他の種類の助言もしくは推奨であることを意図したものではなく、またこれらに該当するものでもありません。詳細は利用規約をご覧ください。