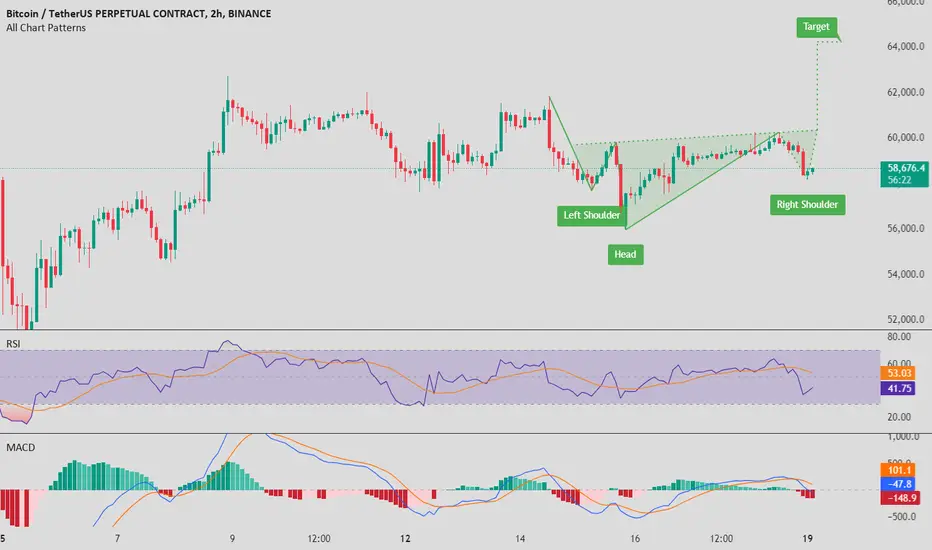
This 2-hour  BTC chart is showing a classic inverse head and shoulders pattern, which typically signals a bullish reversal. We can see that the right shoulder is currently forming, and if the pattern plays out, the price target could be around $64,000. The RSI has dipped below the midline, indicating a brief pullback, but it’s still in a healthy range. The MACD is in a bearish phase, but it could be signaling a potential bottom. Keep an eye on the neckline around $59,000; if BTC can break above that, it could confirm the bullish move.
免責事項
これらの情報および投稿は、TradingViewが提供または承認する金融、投資、取引、またはその他の種類の助言もしくは推奨であることを意図したものではなく、またこれらに該当するものでもありません。詳細は利用規約をご覧ください。
免責事項
これらの情報および投稿は、TradingViewが提供または承認する金融、投資、取引、またはその他の種類の助言もしくは推奨であることを意図したものではなく、またこれらに該当するものでもありません。詳細は利用規約をご覧ください。