
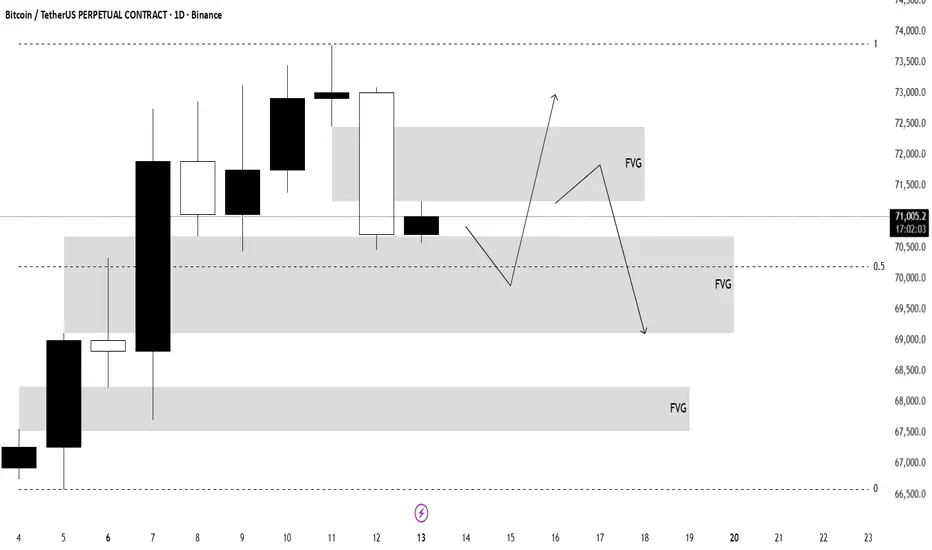
On the 1D timeframe, BTCUSDT is showing clear signs of distribution after a bullish expansion, with price recently sweeping buy-side liquidity above prior highs (~73K–74K) and now beginning to lose momentum.
The large bearish candle indicates a strong displacement, suggesting that smart money has likely initiated sell-side positioning after liquidity was taken. This aligns with ICT concepts of liquidity grab → reversal.
Currently, price is moving back toward the equilibrium (0.5 level ~70K), which acts as a key decision point. A failure to hold above this level strengthens the bearish case.
There are two important imbalances (FVGs) below:
First FVG (~69K–70K) → near-term draw on price
Second FVG (~67K–68K) → deeper discount target
Projected ICT scenario:
Short-term: possible pullback into the upper FVG (~71.5K–72K)
This acts as a premium retracement / inducement zone
Followed by bearish continuation
Targeting sell-side liquidity and FVGs below (~69K → 67K)
Key confluences:
Liquidity sweep above highs (buy-side taken)
Bearish displacement candle (institutional selling)
Price returning to equilibrium
Multiple FVGs below acting as magnets
Execution idea:
Wait for price to retrace into the upper FVG and show bearish confirmation (lower timeframe CHoCH/BOS) before entering short positions.
Invalidation:
If price reclaims and holds above 72K–73K, it suggests continuation of the bullish trend rather than distribution.
This is not financial advice. Always apply proper risk management.
The large bearish candle indicates a strong displacement, suggesting that smart money has likely initiated sell-side positioning after liquidity was taken. This aligns with ICT concepts of liquidity grab → reversal.
Currently, price is moving back toward the equilibrium (0.5 level ~70K), which acts as a key decision point. A failure to hold above this level strengthens the bearish case.
There are two important imbalances (FVGs) below:
First FVG (~69K–70K) → near-term draw on price
Second FVG (~67K–68K) → deeper discount target
Projected ICT scenario:
Short-term: possible pullback into the upper FVG (~71.5K–72K)
This acts as a premium retracement / inducement zone
Followed by bearish continuation
Targeting sell-side liquidity and FVGs below (~69K → 67K)
Key confluences:
Liquidity sweep above highs (buy-side taken)
Bearish displacement candle (institutional selling)
Price returning to equilibrium
Multiple FVGs below acting as magnets
Execution idea:
Wait for price to retrace into the upper FVG and show bearish confirmation (lower timeframe CHoCH/BOS) before entering short positions.
Invalidation:
If price reclaims and holds above 72K–73K, it suggests continuation of the bullish trend rather than distribution.
This is not financial advice. Always apply proper risk management.

免責事項
これらの情報および投稿は、TradingViewが提供または承認する金融、投資、取引、またはその他の種類の助言もしくは推奨であることを意図したものではなく、またこれらに該当するものでもありません。詳細は利用規約をご覧ください。
免責事項
これらの情報および投稿は、TradingViewが提供または承認する金融、投資、取引、またはその他の種類の助言もしくは推奨であることを意図したものではなく、またこれらに該当するものでもありません。詳細は利用規約をご覧ください。