
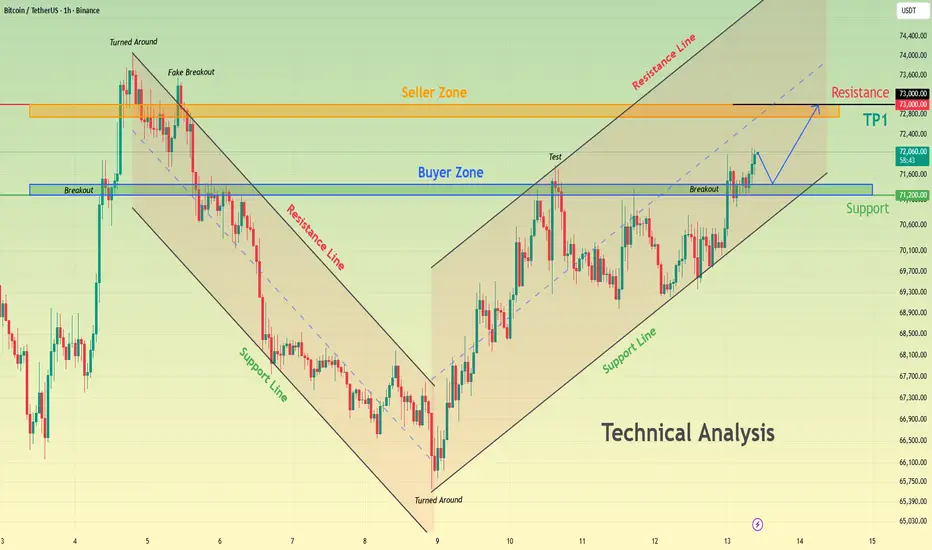
Hello traders! Here’s my technical outlook based on the current BTCUSDT (1H) chart structure. Price previously moved inside a descending channel, where sellers controlled the market and formed lower highs and lower lows. After reaching the lower boundary, BTC reversed sharply and started a recovery phase. The market then broke above the 71,200 resistance, confirming bullish momentum and shifting the short-term structure upward. Currently, price is retesting the 71,200 level, which now acts as a buyer zone, while continuing to move inside an ascending channel. As long as BTC holds above 71,200 support, the bullish bias remains intact. A continuation from this area could push price toward the 73,000 resistance (TP1), which aligns with the seller zone and the upper boundary of the channel. If price falls back below 71,200, a deeper pullback may occur. Please share this idea with your friends and click Boost 🚀
トレード終了: 利益確定目標に到達
We can see that the analysis worked quite well. Buyers were able to push the price to our target where sellers had already intervened.
🔷Join my telegram channel for free - bit.ly/4g4wovR
💰Want receive more profitable signals for Crypto & Forex market, write me PM 👉 bit.ly/4fNijD8
💰Want receive more profitable signals for Crypto & Forex market, write me PM 👉 bit.ly/4fNijD8
免責事項
これらの情報および投稿は、TradingViewが提供または承認する金融、投資、取引、またはその他の種類の助言もしくは推奨であることを意図したものではなく、またこれらに該当するものでもありません。詳細は利用規約をご覧ください。
🔷Join my telegram channel for free - bit.ly/4g4wovR
💰Want receive more profitable signals for Crypto & Forex market, write me PM 👉 bit.ly/4fNijD8
💰Want receive more profitable signals for Crypto & Forex market, write me PM 👉 bit.ly/4fNijD8
免責事項
これらの情報および投稿は、TradingViewが提供または承認する金融、投資、取引、またはその他の種類の助言もしくは推奨であることを意図したものではなく、またこれらに該当するものでもありません。詳細は利用規約をご覧ください。