
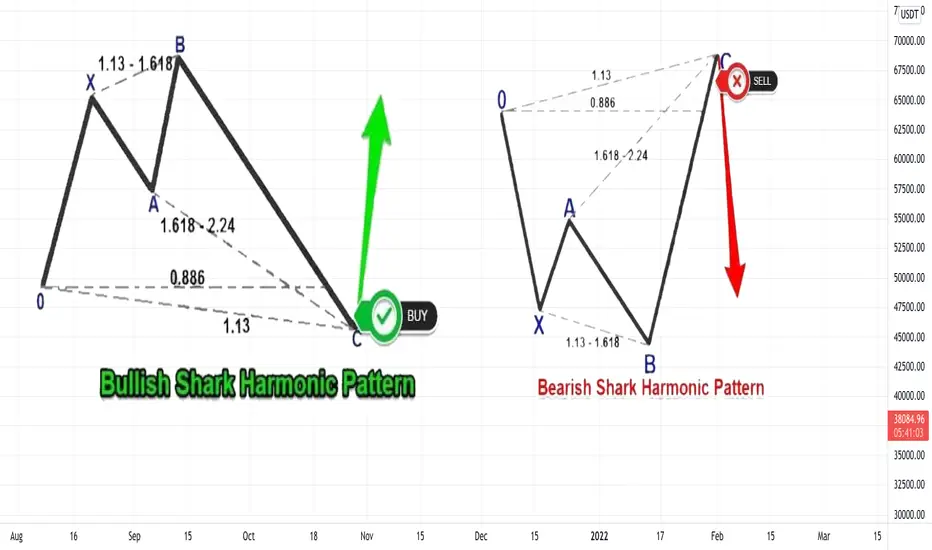
A detailed explanation of the harmonic model SHARK 🦈
The Shark model was discovered in 2011 by Scott Carney
It is somewhat similar to the CRAB model 🦀
🔹 The most important characteristic of this model is that it depends on the 88.6 Fibonacci correction ratio
This model was created by combining Fibonacci numbers and Elliot Wave theory.
The shark model is characterized by the need to specify the points of the model, which are X, A, B, and C
The starting structure of the model is point 0.
In the shark model, point B exceeds point X
🔴 bullish style
1️⃣ No specific patch for A
2️⃣ Point B corrects 113 to 161.8 from XA
3️⃣ Point C for model completion at 88.6 to 113 0X and at 161.8 to 224 AB
🔴 bearish style
1️⃣ No specific patch for A
2️⃣ Point B is a correction from 113 to 161.8 from XA
3️⃣ Point C for model completion at 88.6 to 113 from 0X and at 161.8 to 224 from AB
The Shark model was discovered in 2011 by Scott Carney
It is somewhat similar to the CRAB model 🦀
🔹 The most important characteristic of this model is that it depends on the 88.6 Fibonacci correction ratio
This model was created by combining Fibonacci numbers and Elliot Wave theory.
The shark model is characterized by the need to specify the points of the model, which are X, A, B, and C
The starting structure of the model is point 0.
In the shark model, point B exceeds point X
🔴 bullish style
1️⃣ No specific patch for A
2️⃣ Point B corrects 113 to 161.8 from XA
3️⃣ Point C for model completion at 88.6 to 113 0X and at 161.8 to 224 AB
🔴 bearish style
1️⃣ No specific patch for A
2️⃣ Point B is a correction from 113 to 161.8 from XA
3️⃣ Point C for model completion at 88.6 to 113 from 0X and at 161.8 to 224 from AB
ノート

免責事項
これらの情報および投稿は、TradingViewが提供または承認する金融、投資、取引、またはその他の種類の助言もしくは推奨であることを意図したものではなく、またこれらに該当するものでもありません。詳細は利用規約をご覧ください。
免責事項
これらの情報および投稿は、TradingViewが提供または承認する金融、投資、取引、またはその他の種類の助言もしくは推奨であることを意図したものではなく、またこれらに該当するものでもありません。詳細は利用規約をご覧ください。